29
/
en
AIzaSyAYiBZKx7MnpbEhh9jyipgxe19OcubqV5w
April 1, 2024
95274
Burkina Faso
BFA
true
2
1
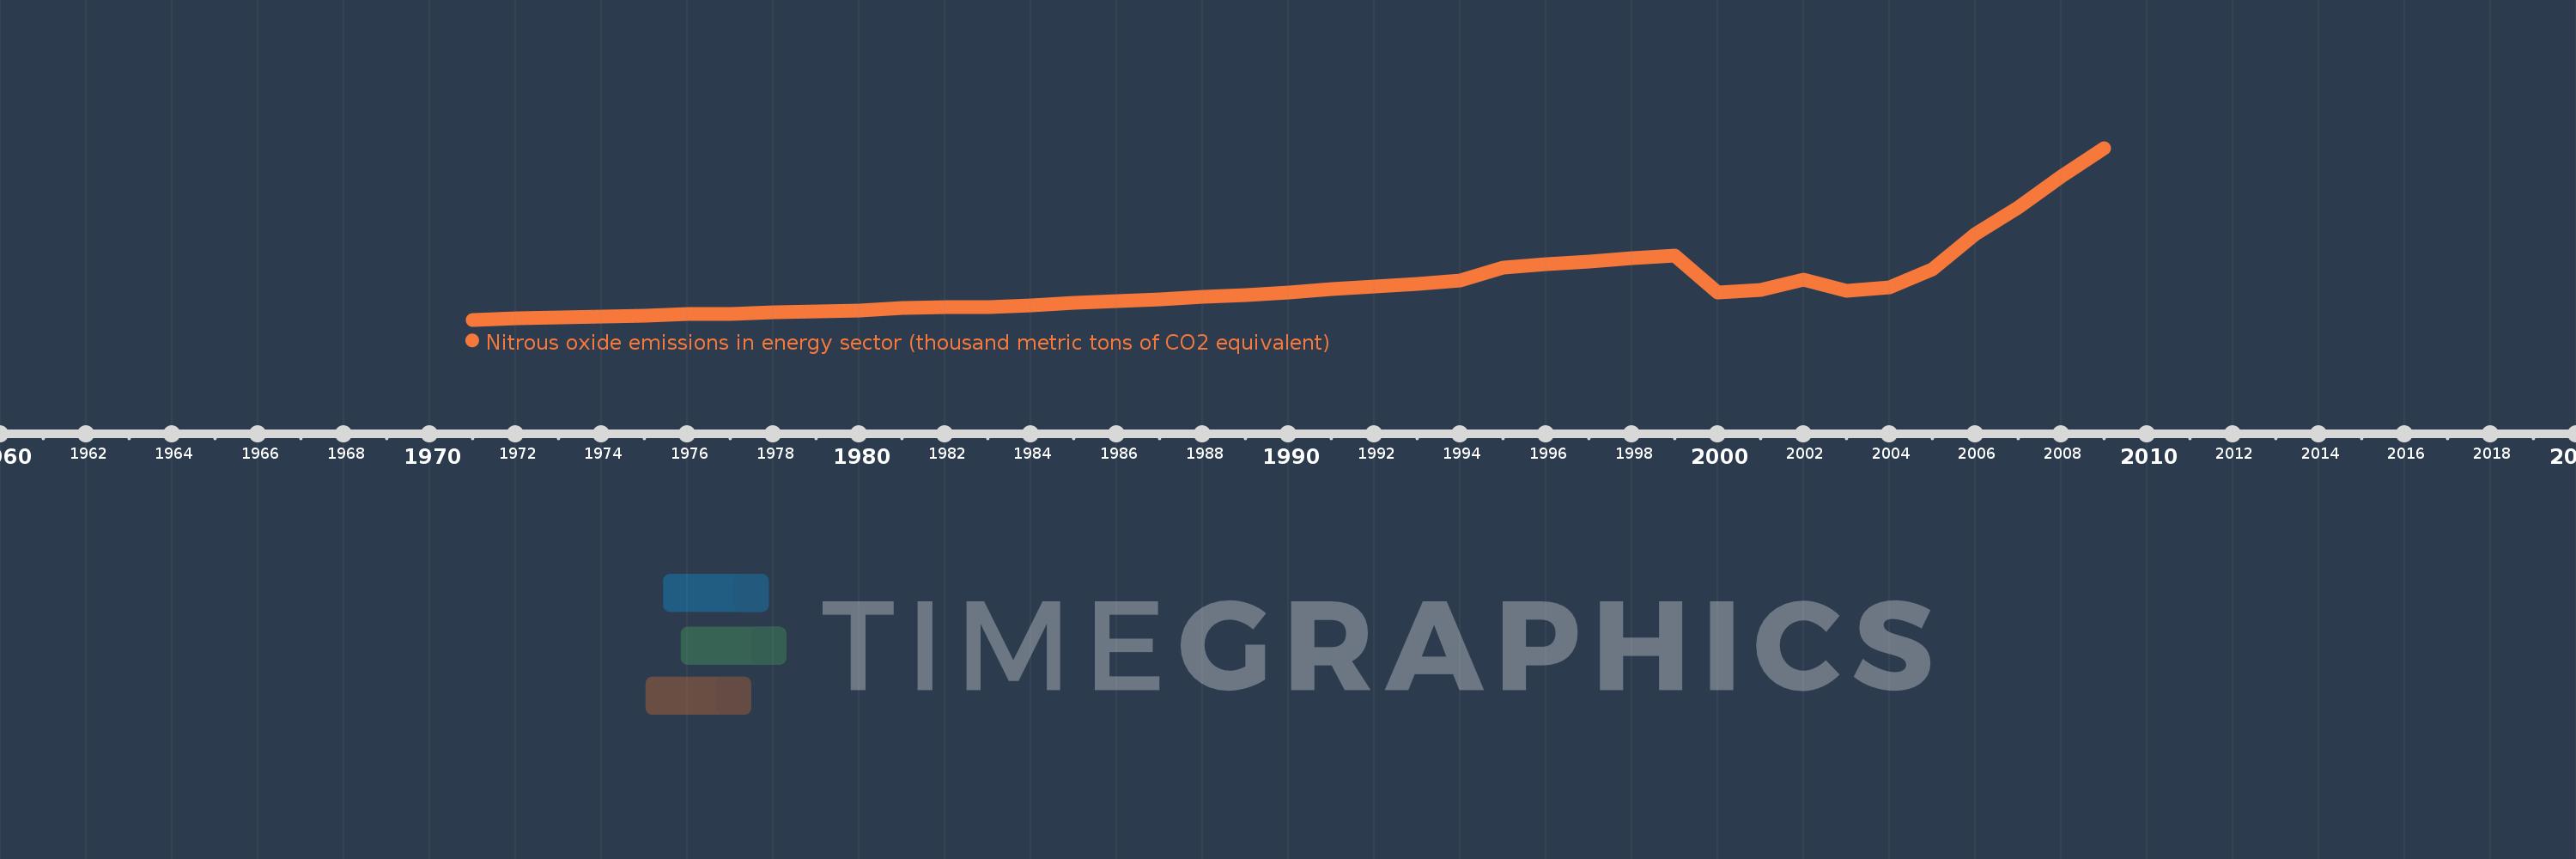
Nitrous oxide emissions in energy sector (thousand metric tons of CO2 equivalent)
2009,2008,2007,2006,2005,2004,2003,2002,2001,2000,1999,1998,1997,1996,1995,1994,1993,1992,1991,1990,1989,1988,1987,1986,1985,1984,1983,1982,1981,1980,1979,1978,1977,1976,1975,1974,1973,1972,1971
This statistics in other country:
AfghanistanAlbaniaAlgeriaAmerican SamoaAndorraAngolaAntigua and BarbudaArab WorldArgentinaArmeniaArubaAustraliaAustriaAzerbaijanBahamas, TheBahrainBangladeshBarbadosBelarusBelgiumBelizeBeninBermudaBhutanBoliviaBosnia and HerzegovinaBotswanaBrazilBritish Virgin IslandsBrunei DarussalamBulgariaBurkina FasoBurundiCabo VerdeCambodiaCameroonCanadaCaribbean small statesCayman IslandsCentral African RepublicCentral Europe and the BalticsChadChannel IslandsChileChinaColombiaComorosCongo, Dem. Rep.Congo, Rep.Costa RicaCote d'IvoireCroatiaCubaCuracaoCyprusCzech RepublicDenmarkDjiboutiDominicaDominican RepublicEarly-demographic dividendEast Asia & PacificEast Asia & Pacific (excluding high income)East Asia & Pacific (IDA & IBRD countries)EcuadorEgypt, Arab Rep.El SalvadorEquatorial GuineaEritreaEstoniaEthiopiaEuro areaEurope & Central AsiaEurope & Central Asia (excluding high income)Europe & Central Asia (IDA & IBRD countries)European UnionFaroe IslandsFijiFinlandFragile and conflict affected situationsFranceFrench PolynesiaGabonGambia, TheGeorgiaGermanyGhanaGibraltarGreeceGreenlandGrenadaGuamGuatemalaGuineaGuinea-BissauGuyanaHaitiHeavily indebted poor countries (HIPC)High incomeHondurasHong Kong SAR, ChinaHungaryIBRD onlyIcelandIDA & IBRD totalIDA blendIDA onlyIDA totalIndiaIndonesiaIran, Islamic Rep.IraqIrelandIsle of ManIsraelItalyJamaicaJapanJordanKazakhstanKenyaKiribatiKorea, Dem. People’s Rep.Korea, Rep.KosovoKuwaitKyrgyz RepublicLao PDRLate-demographic dividendLatin America & Caribbean Latin America & Caribbean (excluding high income)Latin America & the Caribbean (IDA & IBRD countries)LatviaLeast developed countries: UN classificationLebanonLesothoLiberiaLibyaLiechtensteinLithuaniaLow & middle incomeLow incomeLower middle incomeLuxembourgMacao SAR, ChinaMacedonia, FYRMadagascarMalawiMalaysiaMaldivesMaliMaltaMarshall IslandsMauritaniaMauritiusMexicoMicronesia, Fed. Sts.Middle East & North AfricaMiddle East & North Africa (excluding high income)Middle East & North Africa (IDA & IBRD countries)Middle incomeMoldovaMonacoMongoliaMontenegroMoroccoMozambiqueMyanmarNamibiaNauruNepalNetherlandsNew CaledoniaNew ZealandNicaraguaNigerNigeriaNorth AmericaNorthern Mariana IslandsNorwayOECD membersOmanOther small statesPacific island small statesPakistanPalauPanamaPapua New GuineaParaguayPeruPhilippinesPolandPortugalPost-demographic dividendPre-demographic dividendPuerto RicoQatarRomaniaRussian FederationRwandaSamoaSan MarinoSao Tome and PrincipeSaudi ArabiaSenegalSerbiaSeychellesSierra LeoneSingaporeSint Maarten (Dutch part)Slovak RepublicSloveniaSmall statesSolomon IslandsSomaliaSouth AfricaSouth AsiaSouth Asia (IDA & IBRD)South SudanSpainSri LankaSt. Kitts and NevisSt. LuciaSt. Martin (French part)St. Vincent and the GrenadinesSub-Saharan Africa Sub-Saharan Africa (excluding high income)Sub-Saharan Africa (IDA & IBRD countries)SudanSurinameSwazilandSwedenSwitzerlandSyrian Arab RepublicTajikistanTanzaniaThailandTimor-LesteTogoTongaTrinidad and TobagoTunisiaTurkeyTurkmenistanTurks and Caicos IslandsTuvaluUgandaUkraineUnited Arab EmiratesUnited KingdomUnited StatesUpper middle incomeUruguayUzbekistanVanuatuVenezuela, RBVietnamVirgin Islands (U.S.)West Bank and GazaWorldYemen, Rep.ZambiaZimbabwe Timeline:
This timeline shows a graph from 1971 to 2009 of Burkina Faso. No data until 1970. Number of actual observations by date: 39.
Source name:
World Development Indicators
Source organization:
European Commission, Joint Research Centre (JRC)/Netherlands Environmental Assessment Agency (PBL). Emission Database for Global Atmospheric Research (EDGAR): http://edgar.jrc.ec.europa.eu/
Categories, topics:
Energy & Mining, Environment
Last updated:
apr 23, 2017
Indicators value changes by year
Minimum:
116.278
jan 1, 1971
Maximum:
399.263
jan 1, 2009
At the date of observation
Value
Absolute change
Change from previous value
jan 1, 1971
116.278
+116.278
0.0%
jan 1, 1972
118.674
+2.397
2.06%
jan 1, 1973
119.735
+1.06
0.89%
jan 1, 1974
122.085
+2.35
1.96%
jan 1, 1975
123.54
+1.455
1.19%
jan 1, 1976
126.203
+2.663
2.16%
jan 1, 1977
126.037
-0.166
-0.13%
jan 1, 1978
128.7
+2.662
2.11%
jan 1, 1979
130.658
+1.958
1.52%
jan 1, 1980
131.894
+1.236
0.95%
jan 1, 1981
135.225
+3.331
2.53%
jan 1, 1982
137.22
+1.994
1.47%
jan 1, 1983
137.098
-0.121
-0.09%
jan 1, 1984
140.388
+3.29
2.4%
jan 1, 1985
144.595
+4.207
3.0%
jan 1, 1986
146.579
+1.983
1.37%
jan 1, 1987
150.054
+3.475
2.37%
jan 1, 1988
154.0
+3.946
2.63%
jan 1, 1989
157.063
+3.063
1.99%
jan 1, 1990
160.603
+3.54
2.25%
jan 1, 1991
166.731
+6.128
3.82%
jan 1, 1992
170.776
+4.045
2.43%
jan 1, 1993
175.962
+5.186
3.04%
jan 1, 1994
181.22
+5.257
2.99%
jan 1, 1995
201.567
+20.347
11.23%
jan 1, 1996
207.917
+6.35
3.15%
jan 1, 1997
212.153
+4.236
2.04%
jan 1, 1998
218.184
+6.031
2.84%
jan 1, 1999
222.653
+4.469
2.05%
jan 1, 2000
161.718
-60.935
-27.37%
jan 1, 2001
164.71
+2.992
1.85%
jan 1, 2002
182.151
+17.441
10.59%
jan 1, 2003
164.073
-18.078
-9.92%
jan 1, 2004
170.243
+6.169
3.76%
jan 1, 2005
198.867
+28.625
16.81%
jan 1, 2006
257.004
+58.137
29.23%
jan 1, 2007
300.709
+43.705
17.01%
jan 1, 2008
351.93
+51.221
17.03%
jan 1, 2009
399.263
+47.332
13.45%
Ranking of countries by current statistics by years


Comments: