29
/
en
AIzaSyAYiBZKx7MnpbEhh9jyipgxe19OcubqV5w
April 1, 2024
279102
Uzbekistan
UZB
true
2
1
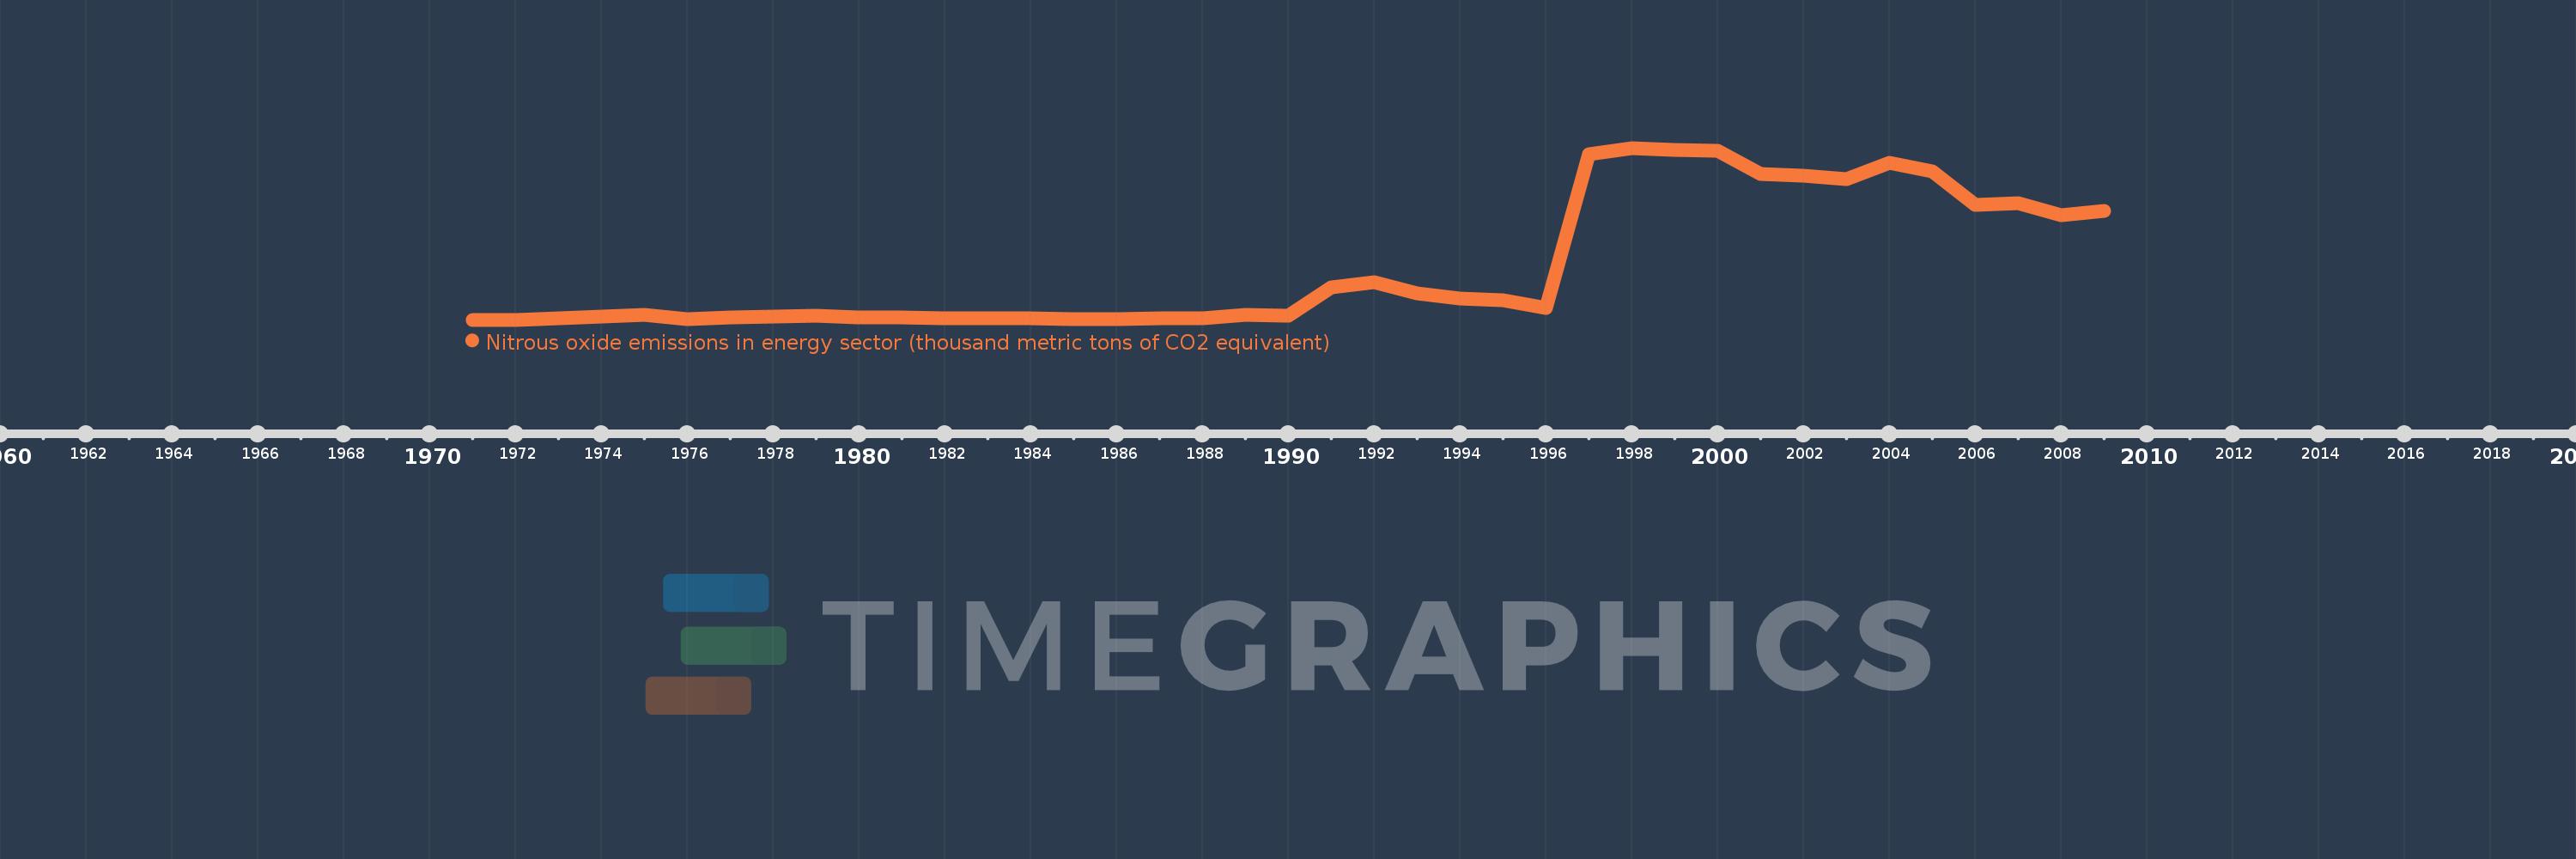
Nitrous oxide emissions in energy sector (thousand metric tons of CO2 equivalent)
2009,2008,2007,2006,2005,2004,2003,2002,2001,2000,1999,1998,1997,1996,1995,1994,1993,1992,1991,1990,1989,1988,1987,1986,1985,1984,1983,1982,1981,1980,1979,1978,1977,1976,1975,1974,1973,1972,1971
This statistics in other country:
AfghanistanAlbaniaAlgeriaAmerican SamoaAndorraAngolaAntigua and BarbudaArab WorldArgentinaArmeniaArubaAustraliaAustriaAzerbaijanBahamas, TheBahrainBangladeshBarbadosBelarusBelgiumBelizeBeninBermudaBhutanBoliviaBosnia and HerzegovinaBotswanaBrazilBritish Virgin IslandsBrunei DarussalamBulgariaBurkina FasoBurundiCabo VerdeCambodiaCameroonCanadaCaribbean small statesCayman IslandsCentral African RepublicCentral Europe and the BalticsChadChannel IslandsChileChinaColombiaComorosCongo, Dem. Rep.Congo, Rep.Costa RicaCote d'IvoireCroatiaCubaCuracaoCyprusCzech RepublicDenmarkDjiboutiDominicaDominican RepublicEarly-demographic dividendEast Asia & PacificEast Asia & Pacific (excluding high income)East Asia & Pacific (IDA & IBRD countries)EcuadorEgypt, Arab Rep.El SalvadorEquatorial GuineaEritreaEstoniaEthiopiaEuro areaEurope & Central AsiaEurope & Central Asia (excluding high income)Europe & Central Asia (IDA & IBRD countries)European UnionFaroe IslandsFijiFinlandFragile and conflict affected situationsFranceFrench PolynesiaGabonGambia, TheGeorgiaGermanyGhanaGibraltarGreeceGreenlandGrenadaGuamGuatemalaGuineaGuinea-BissauGuyanaHaitiHeavily indebted poor countries (HIPC)High incomeHondurasHong Kong SAR, ChinaHungaryIBRD onlyIcelandIDA & IBRD totalIDA blendIDA onlyIDA totalIndiaIndonesiaIran, Islamic Rep.IraqIrelandIsle of ManIsraelItalyJamaicaJapanJordanKazakhstanKenyaKiribatiKorea, Dem. People’s Rep.Korea, Rep.KosovoKuwaitKyrgyz RepublicLao PDRLate-demographic dividendLatin America & Caribbean Latin America & Caribbean (excluding high income)Latin America & the Caribbean (IDA & IBRD countries)LatviaLeast developed countries: UN classificationLebanonLesothoLiberiaLibyaLiechtensteinLithuaniaLow & middle incomeLow incomeLower middle incomeLuxembourgMacao SAR, ChinaMacedonia, FYRMadagascarMalawiMalaysiaMaldivesMaliMaltaMarshall IslandsMauritaniaMauritiusMexicoMicronesia, Fed. Sts.Middle East & North AfricaMiddle East & North Africa (excluding high income)Middle East & North Africa (IDA & IBRD countries)Middle incomeMoldovaMonacoMongoliaMontenegroMoroccoMozambiqueMyanmarNamibiaNauruNepalNetherlandsNew CaledoniaNew ZealandNicaraguaNigerNigeriaNorth AmericaNorthern Mariana IslandsNorwayOECD membersOmanOther small statesPacific island small statesPakistanPalauPanamaPapua New GuineaParaguayPeruPhilippinesPolandPortugalPost-demographic dividendPre-demographic dividendPuerto RicoQatarRomaniaRussian FederationRwandaSamoaSan MarinoSao Tome and PrincipeSaudi ArabiaSenegalSerbiaSeychellesSierra LeoneSingaporeSint Maarten (Dutch part)Slovak RepublicSloveniaSmall statesSolomon IslandsSomaliaSouth AfricaSouth AsiaSouth Asia (IDA & IBRD)South SudanSpainSri LankaSt. Kitts and NevisSt. LuciaSt. Martin (French part)St. Vincent and the GrenadinesSub-Saharan Africa Sub-Saharan Africa (excluding high income)Sub-Saharan Africa (IDA & IBRD countries)SudanSurinameSwazilandSwedenSwitzerlandSyrian Arab RepublicTajikistanTanzaniaThailandTimor-LesteTogoTongaTrinidad and TobagoTunisiaTurkeyTurkmenistanTurks and Caicos IslandsTuvaluUgandaUkraineUnited Arab EmiratesUnited KingdomUnited StatesUpper middle incomeUruguayUzbekistanVanuatuVenezuela, RBVietnamVirgin Islands (U.S.)West Bank and GazaWorldYemen, Rep.ZambiaZimbabwe Timeline:
This timeline shows a graph from 1971 to 2009 of Uzbekistan. No data until 1970. Number of actual observations by date: 39.
Source name:
World Development Indicators
Source organization:
European Commission, Joint Research Centre (JRC)/Netherlands Environmental Assessment Agency (PBL). Emission Database for Global Atmospheric Research (EDGAR): http://edgar.jrc.ec.europa.eu/
Categories, topics:
Energy & Mining, Environment
Last updated:
apr 23, 2017
Indicators value changes by year
Minimum:
93.505
jan 1, 1971
Maximum:
576.124
jan 1, 1998
At the date of observation
Value
Absolute change
Change from previous value
jan 1, 1971
93.505
+93.505
0.0%
jan 1, 1972
93.505
0.0
0.0%
jan 1, 1973
96.613
+3.108
3.32%
jan 1, 1974
101.792
+5.178
5.36%
jan 1, 1975
107.588
+5.796
5.69%
jan 1, 1976
94.079
-13.508
-12.56%
jan 1, 1977
98.913
+4.834
5.14%
jan 1, 1978
101.993
+3.08
3.11%
jan 1, 1979
104.048
+2.055
2.01%
jan 1, 1980
99.26
-4.787
-4.6%
jan 1, 1981
98.921
-0.339
-0.34%
jan 1, 1982
98.125
-0.796
-0.81%
jan 1, 1983
98.752
+0.628
0.64%
jan 1, 1984
96.889
-1.864
-1.89%
jan 1, 1985
95.591
-1.297
-1.34%
jan 1, 1986
96.305
+0.713
0.75%
jan 1, 1987
98.162
+1.858
1.93%
jan 1, 1988
98.604
+0.442
0.45%
jan 1, 1989
107.531
+8.926
9.05%
jan 1, 1990
105.967
-1.563
-1.45%
jan 1, 1991
185.124
+79.157
74.7%
jan 1, 1992
199.406
+14.282
7.72%
jan 1, 1993
166.89
-32.516
-16.31%
jan 1, 1994
153.574
-13.316
-7.98%
jan 1, 1995
148.19
-5.385
-3.51%
jan 1, 1996
127.356
-20.834
-14.06%
jan 1, 1997
558.222
+430.866
338.32%
jan 1, 1998
576.124
+17.902
3.21%
jan 1, 1999
570.732
-5.392
-0.94%
jan 1, 2000
568.445
-2.286
-0.4%
jan 1, 2001
504.168
-64.278
-11.31%
jan 1, 2002
498.297
-5.87
-1.16%
jan 1, 2003
488.065
-10.232
-2.05%
jan 1, 2004
535.023
+46.958
9.62%
jan 1, 2005
510.045
-24.978
-4.67%
jan 1, 2006
415.889
-94.156
-18.46%
jan 1, 2007
419.764
+3.875
0.93%
jan 1, 2008
387.673
-32.091
-7.65%
jan 1, 2009
399.061
+11.388
2.94%
Ranking of countries by current statistics by years


Comments: