29
/
en
AIzaSyAYiBZKx7MnpbEhh9jyipgxe19OcubqV5w
April 1, 2024
262690
Thailand
THA
true
2
1
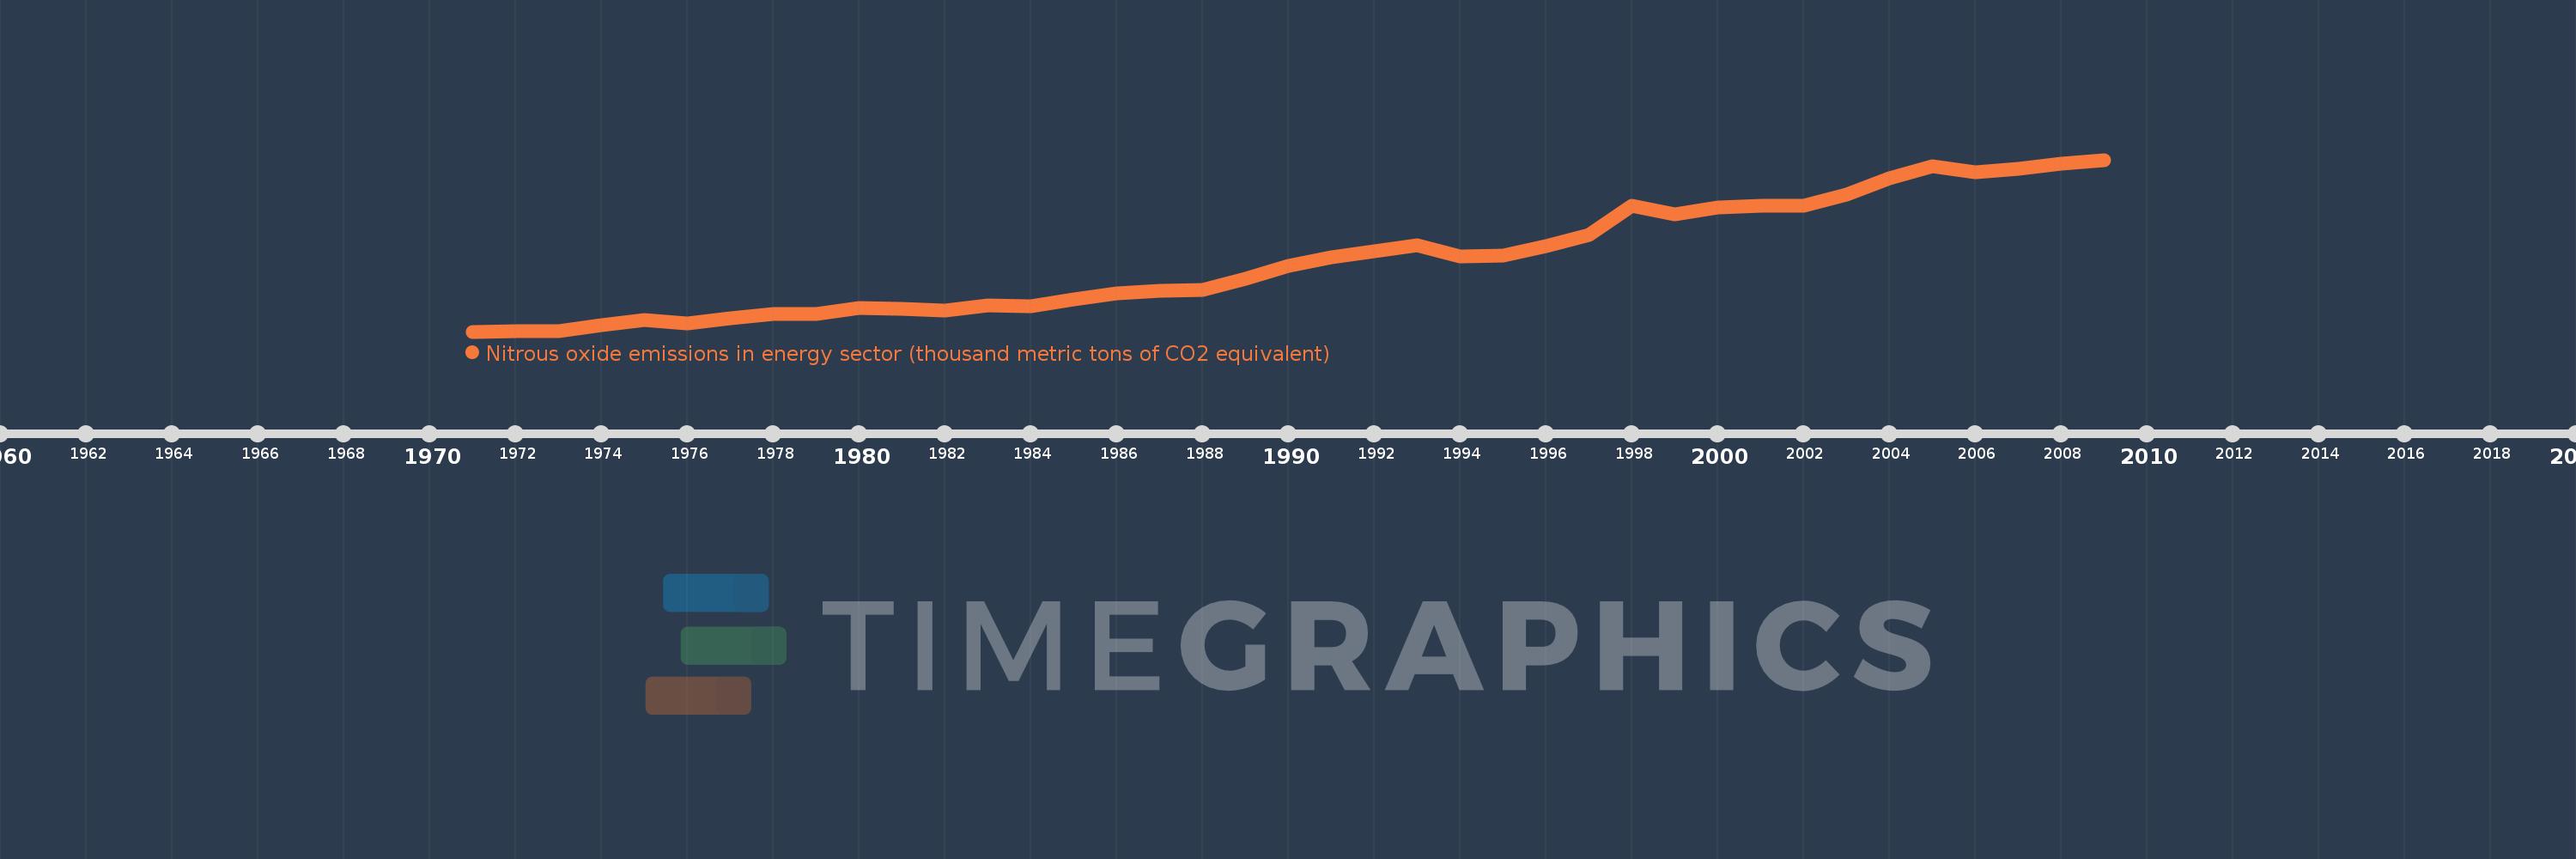
Nitrous oxide emissions in energy sector (thousand metric tons of CO2 equivalent)
2009,2008,2007,2006,2005,2004,2003,2002,2001,2000,1999,1998,1997,1996,1995,1994,1993,1992,1991,1990,1989,1988,1987,1986,1985,1984,1983,1982,1981,1980,1979,1978,1977,1976,1975,1974,1973,1972,1971
This statistics in other country:
AfghanistanAlbaniaAlgeriaAmerican SamoaAndorraAngolaAntigua and BarbudaArab WorldArgentinaArmeniaArubaAustraliaAustriaAzerbaijanBahamas, TheBahrainBangladeshBarbadosBelarusBelgiumBelizeBeninBermudaBhutanBoliviaBosnia and HerzegovinaBotswanaBrazilBritish Virgin IslandsBrunei DarussalamBulgariaBurkina FasoBurundiCabo VerdeCambodiaCameroonCanadaCaribbean small statesCayman IslandsCentral African RepublicCentral Europe and the BalticsChadChannel IslandsChileChinaColombiaComorosCongo, Dem. Rep.Congo, Rep.Costa RicaCote d'IvoireCroatiaCubaCuracaoCyprusCzech RepublicDenmarkDjiboutiDominicaDominican RepublicEarly-demographic dividendEast Asia & PacificEast Asia & Pacific (excluding high income)East Asia & Pacific (IDA & IBRD countries)EcuadorEgypt, Arab Rep.El SalvadorEquatorial GuineaEritreaEstoniaEthiopiaEuro areaEurope & Central AsiaEurope & Central Asia (excluding high income)Europe & Central Asia (IDA & IBRD countries)European UnionFaroe IslandsFijiFinlandFragile and conflict affected situationsFranceFrench PolynesiaGabonGambia, TheGeorgiaGermanyGhanaGibraltarGreeceGreenlandGrenadaGuamGuatemalaGuineaGuinea-BissauGuyanaHaitiHeavily indebted poor countries (HIPC)High incomeHondurasHong Kong SAR, ChinaHungaryIBRD onlyIcelandIDA & IBRD totalIDA blendIDA onlyIDA totalIndiaIndonesiaIran, Islamic Rep.IraqIrelandIsle of ManIsraelItalyJamaicaJapanJordanKazakhstanKenyaKiribatiKorea, Dem. People’s Rep.Korea, Rep.KosovoKuwaitKyrgyz RepublicLao PDRLate-demographic dividendLatin America & Caribbean Latin America & Caribbean (excluding high income)Latin America & the Caribbean (IDA & IBRD countries)LatviaLeast developed countries: UN classificationLebanonLesothoLiberiaLibyaLiechtensteinLithuaniaLow & middle incomeLow incomeLower middle incomeLuxembourgMacao SAR, ChinaMacedonia, FYRMadagascarMalawiMalaysiaMaldivesMaliMaltaMarshall IslandsMauritaniaMauritiusMexicoMicronesia, Fed. Sts.Middle East & North AfricaMiddle East & North Africa (excluding high income)Middle East & North Africa (IDA & IBRD countries)Middle incomeMoldovaMonacoMongoliaMontenegroMoroccoMozambiqueMyanmarNamibiaNauruNepalNetherlandsNew CaledoniaNew ZealandNicaraguaNigerNigeriaNorth AmericaNorthern Mariana IslandsNorwayOECD membersOmanOther small statesPacific island small statesPakistanPalauPanamaPapua New GuineaParaguayPeruPhilippinesPolandPortugalPost-demographic dividendPre-demographic dividendPuerto RicoQatarRomaniaRussian FederationRwandaSamoaSan MarinoSao Tome and PrincipeSaudi ArabiaSenegalSerbiaSeychellesSierra LeoneSingaporeSint Maarten (Dutch part)Slovak RepublicSloveniaSmall statesSolomon IslandsSomaliaSouth AfricaSouth AsiaSouth Asia (IDA & IBRD)South SudanSpainSri LankaSt. Kitts and NevisSt. LuciaSt. Martin (French part)St. Vincent and the GrenadinesSub-Saharan Africa Sub-Saharan Africa (excluding high income)Sub-Saharan Africa (IDA & IBRD countries)SudanSurinameSwazilandSwedenSwitzerlandSyrian Arab RepublicTajikistanTanzaniaThailandTimor-LesteTogoTongaTrinidad and TobagoTunisiaTurkeyTurkmenistanTurks and Caicos IslandsTuvaluUgandaUkraineUnited Arab EmiratesUnited KingdomUnited StatesUpper middle incomeUruguayUzbekistanVanuatuVenezuela, RBVietnamVirgin Islands (U.S.)West Bank and GazaWorldYemen, Rep.ZambiaZimbabwe Timeline:
This timeline shows a graph from 1971 to 2009 of Thailand. No data until 1970. Number of actual observations by date: 39.
Source name:
World Development Indicators
Source organization:
European Commission, Joint Research Centre (JRC)/Netherlands Environmental Assessment Agency (PBL). Emission Database for Global Atmospheric Research (EDGAR): http://edgar.jrc.ec.europa.eu/
Categories, topics:
Energy & Mining, Environment
Last updated:
apr 23, 2017
Indicators value changes by year
Minimum:
916.269
jan 1, 1971
Maximum:
2.881K
jan 1, 2009
At the date of observation
Value
Absolute change
Change from previous value
jan 1, 1971
916.269
+916.269
0.0%
jan 1, 1972
920.491
+4.222
0.46%
jan 1, 1973
917.483
-3.008
-0.33%
jan 1, 1974
987.542
+70.059
7.64%
jan 1, 1975
1.051K
+63.699
6.45%
jan 1, 1976
1.008K
-43.544
-4.14%
jan 1, 1977
1.071K
+62.886
6.24%
jan 1, 1978
1.114K
+42.946
4.01%
jan 1, 1979
1.12K
+6.89
0.62%
jan 1, 1980
1.183K
+62.604
5.59%
jan 1, 1981
1.174K
-9.473
-0.8%
jan 1, 1982
1.154K
-19.295
-1.64%
jan 1, 1983
1.215K
+61.035
5.29%
jan 1, 1984
1.206K
-9.635
-0.79%
jan 1, 1985
1.289K
+83.808
6.95%
jan 1, 1986
1.352K
+62.992
4.89%
jan 1, 1987
1.387K
+35.019
2.59%
jan 1, 1988
1.393K
+5.747
0.41%
jan 1, 1989
1.521K
+128.139
9.2%
jan 1, 1990
1.672K
+150.414
9.89%
jan 1, 1991
1.765K
+93.64
5.6%
jan 1, 1992
1.832K
+67.035
3.8%
jan 1, 1993
1.905K
+72.165
3.94%
jan 1, 1994
1.775K
-129.27
-6.79%
jan 1, 1995
1.787K
+11.919
0.67%
jan 1, 1996
1.889K
+101.603
5.68%
jan 1, 1997
2.023K
+133.679
7.08%
jan 1, 1998
2.355K
+332.41
16.44%
jan 1, 1999
2.253K
-101.595
-4.31%
jan 1, 2000
2.34K
+86.73
3.85%
jan 1, 2001
2.356K
+15.574
0.67%
jan 1, 2002
2.354K
-1.313
-0.06%
jan 1, 2003
2.484K
+129.7
5.51%
jan 1, 2004
2.671K
+186.636
7.51%
jan 1, 2005
2.804K
+133.533
5.0%
jan 1, 2006
2.734K
-70.251
-2.51%
jan 1, 2007
2.782K
+48.034
1.76%
jan 1, 2008
2.841K
+59.445
2.14%
jan 1, 2009
2.881K
+39.426
1.39%
Ranking of countries by current statistics by years


Comments: