29
/
en
AIzaSyAYiBZKx7MnpbEhh9jyipgxe19OcubqV5w
April 1, 2024
231465
Rwanda
RWA
true
2
1
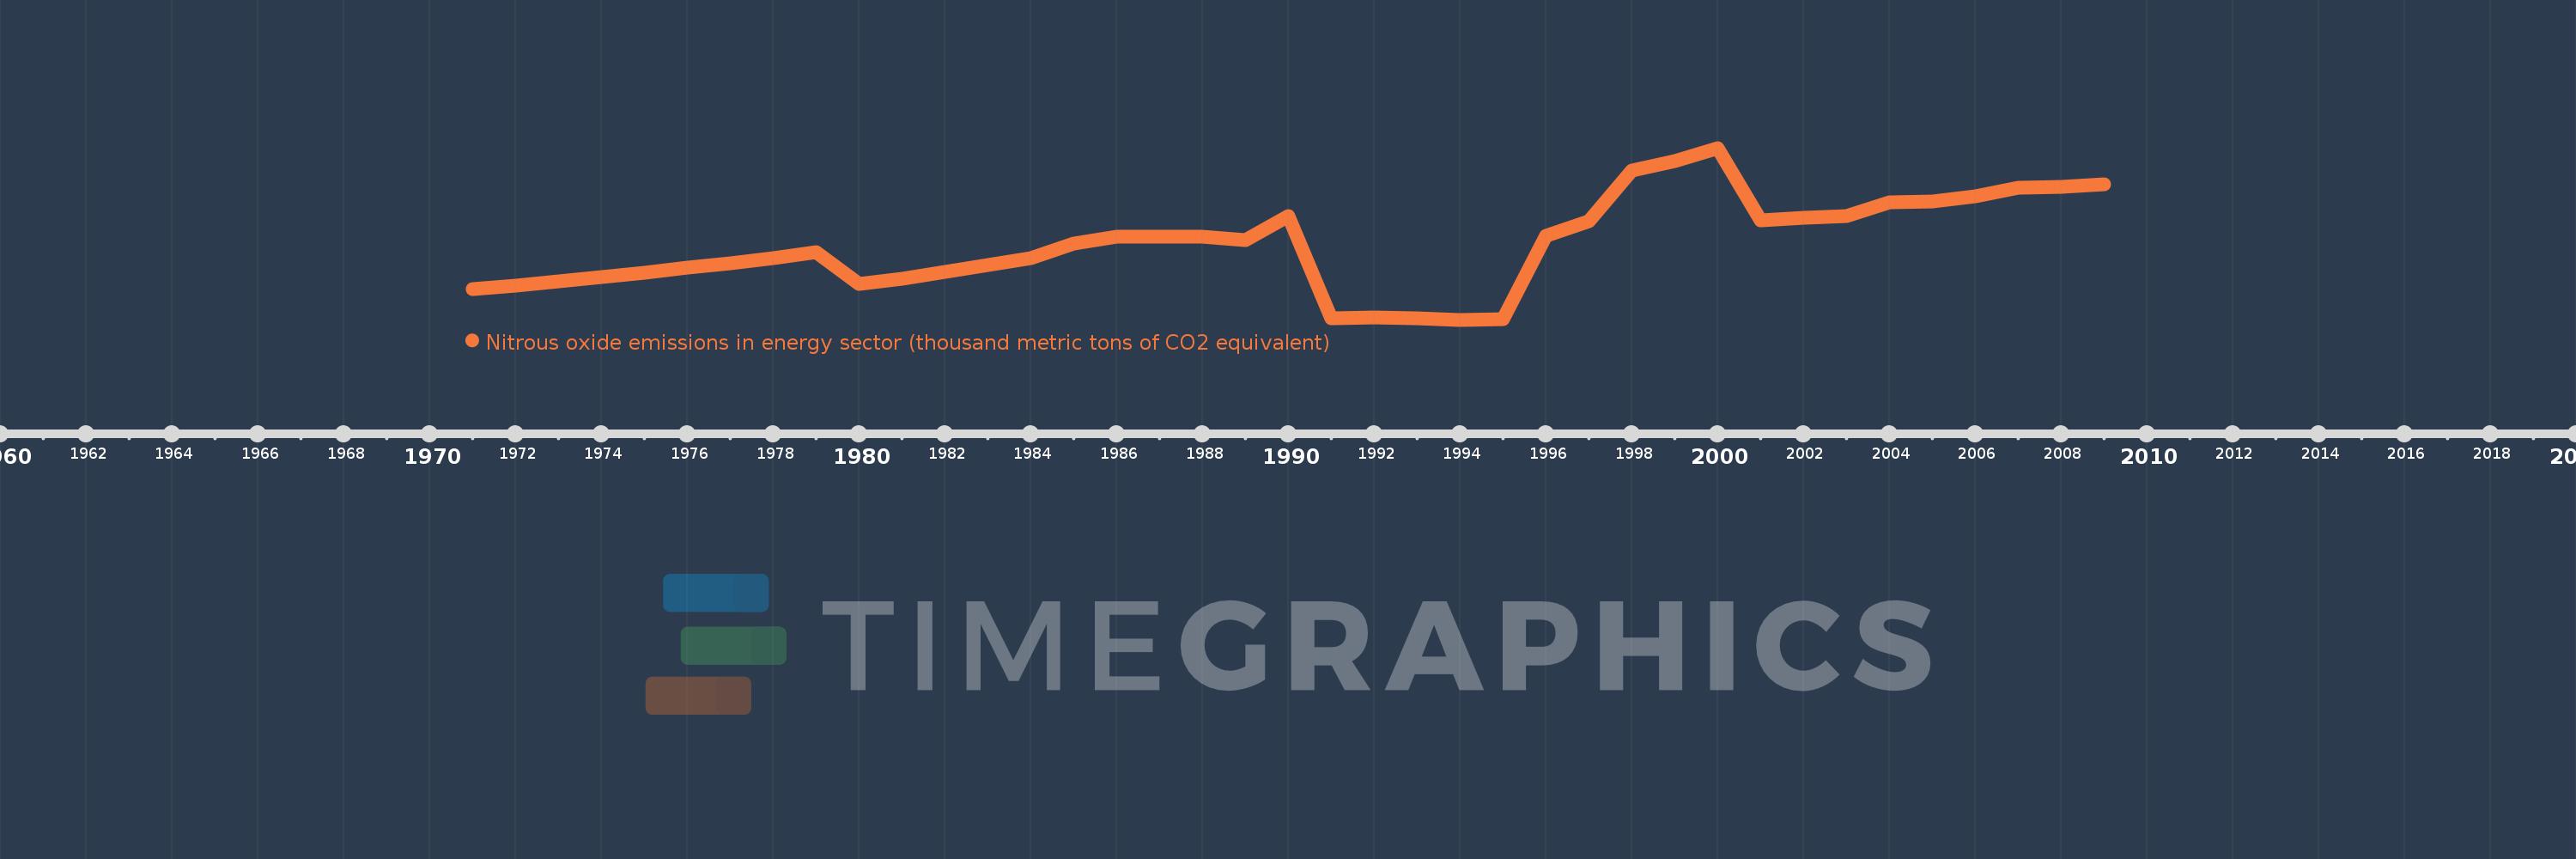
Nitrous oxide emissions in energy sector (thousand metric tons of CO2 equivalent)
2009,2008,2007,2006,2005,2004,2003,2002,2001,2000,1999,1998,1997,1996,1995,1994,1993,1992,1991,1990,1989,1988,1987,1986,1985,1984,1983,1982,1981,1980,1979,1978,1977,1976,1975,1974,1973,1972,1971
This statistics in other country:
AfghanistanAlbaniaAlgeriaAmerican SamoaAndorraAngolaAntigua and BarbudaArab WorldArgentinaArmeniaArubaAustraliaAustriaAzerbaijanBahamas, TheBahrainBangladeshBarbadosBelarusBelgiumBelizeBeninBermudaBhutanBoliviaBosnia and HerzegovinaBotswanaBrazilBritish Virgin IslandsBrunei DarussalamBulgariaBurkina FasoBurundiCabo VerdeCambodiaCameroonCanadaCaribbean small statesCayman IslandsCentral African RepublicCentral Europe and the BalticsChadChannel IslandsChileChinaColombiaComorosCongo, Dem. Rep.Congo, Rep.Costa RicaCote d'IvoireCroatiaCubaCuracaoCyprusCzech RepublicDenmarkDjiboutiDominicaDominican RepublicEarly-demographic dividendEast Asia & PacificEast Asia & Pacific (excluding high income)East Asia & Pacific (IDA & IBRD countries)EcuadorEgypt, Arab Rep.El SalvadorEquatorial GuineaEritreaEstoniaEthiopiaEuro areaEurope & Central AsiaEurope & Central Asia (excluding high income)Europe & Central Asia (IDA & IBRD countries)European UnionFaroe IslandsFijiFinlandFragile and conflict affected situationsFranceFrench PolynesiaGabonGambia, TheGeorgiaGermanyGhanaGibraltarGreeceGreenlandGrenadaGuamGuatemalaGuineaGuinea-BissauGuyanaHaitiHeavily indebted poor countries (HIPC)High incomeHondurasHong Kong SAR, ChinaHungaryIBRD onlyIcelandIDA & IBRD totalIDA blendIDA onlyIDA totalIndiaIndonesiaIran, Islamic Rep.IraqIrelandIsle of ManIsraelItalyJamaicaJapanJordanKazakhstanKenyaKiribatiKorea, Dem. People’s Rep.Korea, Rep.KosovoKuwaitKyrgyz RepublicLao PDRLate-demographic dividendLatin America & Caribbean Latin America & Caribbean (excluding high income)Latin America & the Caribbean (IDA & IBRD countries)LatviaLeast developed countries: UN classificationLebanonLesothoLiberiaLibyaLiechtensteinLithuaniaLow & middle incomeLow incomeLower middle incomeLuxembourgMacao SAR, ChinaMacedonia, FYRMadagascarMalawiMalaysiaMaldivesMaliMaltaMarshall IslandsMauritaniaMauritiusMexicoMicronesia, Fed. Sts.Middle East & North AfricaMiddle East & North Africa (excluding high income)Middle East & North Africa (IDA & IBRD countries)Middle incomeMoldovaMonacoMongoliaMontenegroMoroccoMozambiqueMyanmarNamibiaNauruNepalNetherlandsNew CaledoniaNew ZealandNicaraguaNigerNigeriaNorth AmericaNorthern Mariana IslandsNorwayOECD membersOmanOther small statesPacific island small statesPakistanPalauPanamaPapua New GuineaParaguayPeruPhilippinesPolandPortugalPost-demographic dividendPre-demographic dividendPuerto RicoQatarRomaniaRussian FederationRwandaSamoaSan MarinoSao Tome and PrincipeSaudi ArabiaSenegalSerbiaSeychellesSierra LeoneSingaporeSint Maarten (Dutch part)Slovak RepublicSloveniaSmall statesSolomon IslandsSomaliaSouth AfricaSouth AsiaSouth Asia (IDA & IBRD)South SudanSpainSri LankaSt. Kitts and NevisSt. LuciaSt. Martin (French part)St. Vincent and the GrenadinesSub-Saharan Africa Sub-Saharan Africa (excluding high income)Sub-Saharan Africa (IDA & IBRD countries)SudanSurinameSwazilandSwedenSwitzerlandSyrian Arab RepublicTajikistanTanzaniaThailandTimor-LesteTogoTongaTrinidad and TobagoTunisiaTurkeyTurkmenistanTurks and Caicos IslandsTuvaluUgandaUkraineUnited Arab EmiratesUnited KingdomUnited StatesUpper middle incomeUruguayUzbekistanVanuatuVenezuela, RBVietnamVirgin Islands (U.S.)West Bank and GazaWorldYemen, Rep.ZambiaZimbabwe Timeline:
This timeline shows a graph from 1971 to 2009 of Rwanda. No data until 1970. Number of actual observations by date: 39.
Source name:
World Development Indicators
Source organization:
European Commission, Joint Research Centre (JRC)/Netherlands Environmental Assessment Agency (PBL). Emission Database for Global Atmospheric Research (EDGAR): http://edgar.jrc.ec.europa.eu/
Categories, topics:
Energy & Mining, Environment
Last updated:
apr 23, 2017
Indicators value changes by year
Minimum:
50.256
jan 1, 1994
Maximum:
130.735
jan 1, 2000
At the date of observation
Value
Absolute change
Change from previous value
jan 1, 1971
64.644
+64.644
0.0%
jan 1, 1972
66.347
+1.702
2.63%
jan 1, 1973
68.144
+1.797
2.71%
jan 1, 1974
70.135
+1.991
2.92%
jan 1, 1975
72.211
+2.076
2.96%
jan 1, 1976
74.538
+2.328
3.22%
jan 1, 1977
76.872
+2.333
3.13%
jan 1, 1978
79.286
+2.414
3.14%
jan 1, 1979
81.888
+2.602
3.28%
jan 1, 1980
66.856
-15.032
-18.36%
jan 1, 1981
69.563
+2.707
4.05%
jan 1, 1982
72.82
+3.257
4.68%
jan 1, 1983
75.947
+3.127
4.29%
jan 1, 1984
79.275
+3.328
4.38%
jan 1, 1985
85.934
+6.659
8.4%
jan 1, 1986
89.149
+3.215
3.74%
jan 1, 1987
89.16
+0.011
0.01%
jan 1, 1988
89.076
-0.084
-0.09%
jan 1, 1989
87.676
-1.4
-1.57%
jan 1, 1990
99.013
+11.337
12.93%
jan 1, 1991
51.012
-48.001
-48.48%
jan 1, 1992
51.497
+0.485
0.95%
jan 1, 1993
51.126
-0.371
-0.72%
jan 1, 1994
50.256
-0.87
-1.7%
jan 1, 1995
50.719
+0.463
0.92%
jan 1, 1996
89.648
+38.929
76.75%
jan 1, 1997
96.503
+6.855
7.65%
jan 1, 1998
120.209
+23.706
24.56%
jan 1, 1999
124.381
+4.172
3.47%
jan 1, 2000
130.735
+6.354
5.11%
jan 1, 2001
96.804
-33.931
-25.95%
jan 1, 2002
98.095
+1.292
1.33%
jan 1, 2003
98.704
+0.608
0.62%
jan 1, 2004
105.291
+6.588
6.67%
jan 1, 2005
105.589
+0.298
0.28%
jan 1, 2006
107.89
+2.301
2.18%
jan 1, 2007
111.921
+4.031
3.74%
jan 1, 2008
112.664
+0.743
0.66%
jan 1, 2009
113.604
+0.939
0.83%
Ranking of countries by current statistics by years


Comments: