29
/
en
AIzaSyAYiBZKx7MnpbEhh9jyipgxe19OcubqV5w
April 1, 2024
253417
Sudan
SDN
true
2
1
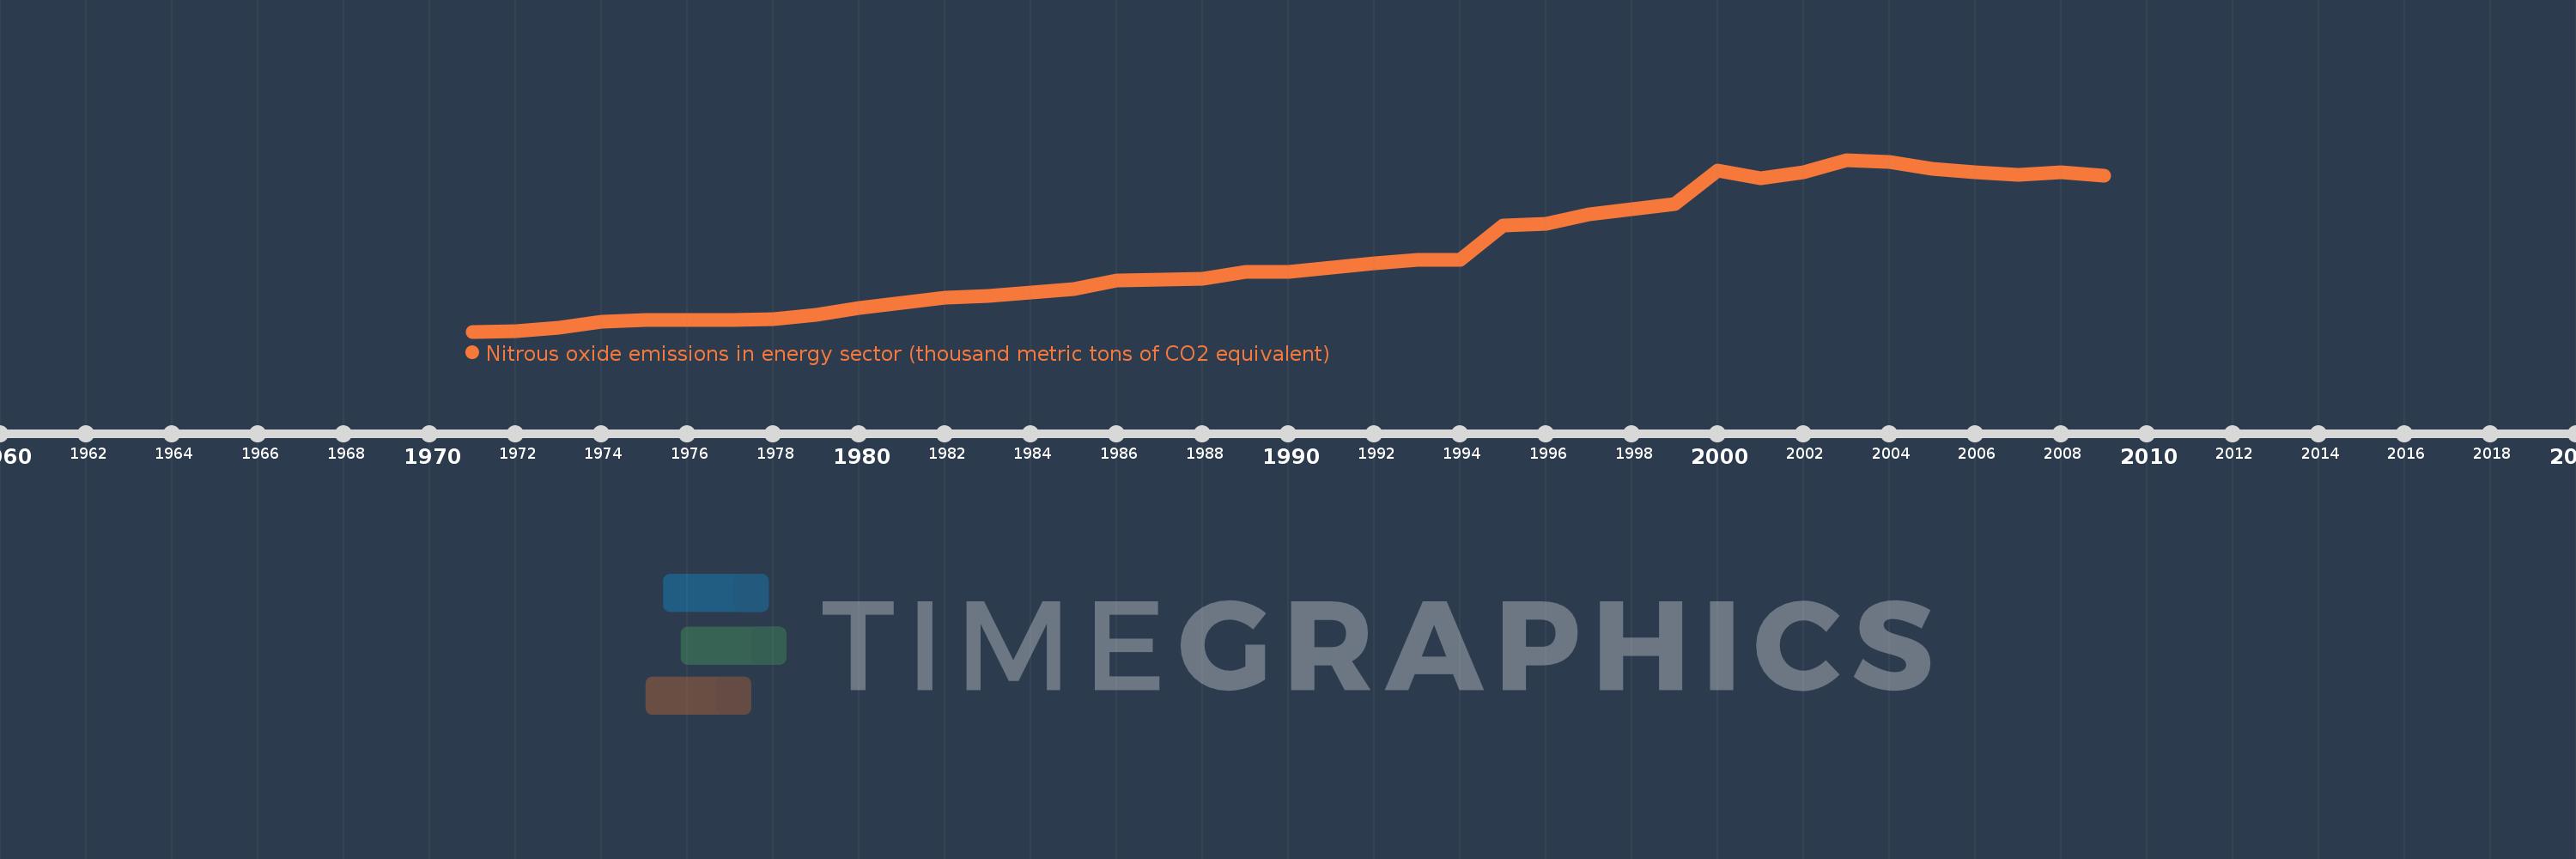
Nitrous oxide emissions in energy sector (thousand metric tons of CO2 equivalent)
2009,2008,2007,2006,2005,2004,2003,2002,2001,2000,1999,1998,1997,1996,1995,1994,1993,1992,1991,1990,1989,1988,1987,1986,1985,1984,1983,1982,1981,1980,1979,1978,1977,1976,1975,1974,1973,1972,1971
This statistics in other country:
AfghanistanAlbaniaAlgeriaAmerican SamoaAndorraAngolaAntigua and BarbudaArab WorldArgentinaArmeniaArubaAustraliaAustriaAzerbaijanBahamas, TheBahrainBangladeshBarbadosBelarusBelgiumBelizeBeninBermudaBhutanBoliviaBosnia and HerzegovinaBotswanaBrazilBritish Virgin IslandsBrunei DarussalamBulgariaBurkina FasoBurundiCabo VerdeCambodiaCameroonCanadaCaribbean small statesCayman IslandsCentral African RepublicCentral Europe and the BalticsChadChannel IslandsChileChinaColombiaComorosCongo, Dem. Rep.Congo, Rep.Costa RicaCote d'IvoireCroatiaCubaCuracaoCyprusCzech RepublicDenmarkDjiboutiDominicaDominican RepublicEarly-demographic dividendEast Asia & PacificEast Asia & Pacific (excluding high income)East Asia & Pacific (IDA & IBRD countries)EcuadorEgypt, Arab Rep.El SalvadorEquatorial GuineaEritreaEstoniaEthiopiaEuro areaEurope & Central AsiaEurope & Central Asia (excluding high income)Europe & Central Asia (IDA & IBRD countries)European UnionFaroe IslandsFijiFinlandFragile and conflict affected situationsFranceFrench PolynesiaGabonGambia, TheGeorgiaGermanyGhanaGibraltarGreeceGreenlandGrenadaGuamGuatemalaGuineaGuinea-BissauGuyanaHaitiHeavily indebted poor countries (HIPC)High incomeHondurasHong Kong SAR, ChinaHungaryIBRD onlyIcelandIDA & IBRD totalIDA blendIDA onlyIDA totalIndiaIndonesiaIran, Islamic Rep.IraqIrelandIsle of ManIsraelItalyJamaicaJapanJordanKazakhstanKenyaKiribatiKorea, Dem. People’s Rep.Korea, Rep.KosovoKuwaitKyrgyz RepublicLao PDRLate-demographic dividendLatin America & Caribbean Latin America & Caribbean (excluding high income)Latin America & the Caribbean (IDA & IBRD countries)LatviaLeast developed countries: UN classificationLebanonLesothoLiberiaLibyaLiechtensteinLithuaniaLow & middle incomeLow incomeLower middle incomeLuxembourgMacao SAR, ChinaMacedonia, FYRMadagascarMalawiMalaysiaMaldivesMaliMaltaMarshall IslandsMauritaniaMauritiusMexicoMicronesia, Fed. Sts.Middle East & North AfricaMiddle East & North Africa (excluding high income)Middle East & North Africa (IDA & IBRD countries)Middle incomeMoldovaMonacoMongoliaMontenegroMoroccoMozambiqueMyanmarNamibiaNauruNepalNetherlandsNew CaledoniaNew ZealandNicaraguaNigerNigeriaNorth AmericaNorthern Mariana IslandsNorwayOECD membersOmanOther small statesPacific island small statesPakistanPalauPanamaPapua New GuineaParaguayPeruPhilippinesPolandPortugalPost-demographic dividendPre-demographic dividendPuerto RicoQatarRomaniaRussian FederationRwandaSamoaSan MarinoSao Tome and PrincipeSaudi ArabiaSenegalSerbiaSeychellesSierra LeoneSingaporeSint Maarten (Dutch part)Slovak RepublicSloveniaSmall statesSolomon IslandsSomaliaSouth AfricaSouth AsiaSouth Asia (IDA & IBRD)South SudanSpainSri LankaSt. Kitts and NevisSt. LuciaSt. Martin (French part)St. Vincent and the GrenadinesSub-Saharan Africa Sub-Saharan Africa (excluding high income)Sub-Saharan Africa (IDA & IBRD countries)SudanSurinameSwazilandSwedenSwitzerlandSyrian Arab RepublicTajikistanTanzaniaThailandTimor-LesteTogoTongaTrinidad and TobagoTunisiaTurkeyTurkmenistanTurks and Caicos IslandsTuvaluUgandaUkraineUnited Arab EmiratesUnited KingdomUnited StatesUpper middle incomeUruguayUzbekistanVanuatuVenezuela, RBVietnamVirgin Islands (U.S.)West Bank and GazaWorldYemen, Rep.ZambiaZimbabwe Timeline:
This timeline shows a graph from 1971 to 2009 of Sudan. No data until 1970. Number of actual observations by date: 39.
Source name:
World Development Indicators
Source organization:
European Commission, Joint Research Centre (JRC)/Netherlands Environmental Assessment Agency (PBL). Emission Database for Global Atmospheric Research (EDGAR): http://edgar.jrc.ec.europa.eu/
Categories, topics:
Energy & Mining, Environment
Last updated:
apr 23, 2017
Indicators value changes by year
Minimum:
236.622
jan 1, 1971
Maximum:
664.326
jan 1, 2003
At the date of observation
Value
Absolute change
Change from previous value
jan 1, 1971
236.622
+236.622
0.0%
jan 1, 1972
238.496
+1.874
0.79%
jan 1, 1973
246.389
+7.893
3.31%
jan 1, 1974
262.071
+15.682
6.36%
jan 1, 1975
264.613
+2.542
0.97%
jan 1, 1976
265.066
+0.453
0.17%
jan 1, 1977
265.85
+0.784
0.3%
jan 1, 1978
268.336
+2.486
0.94%
jan 1, 1979
278.859
+10.523
3.92%
jan 1, 1980
294.665
+15.807
5.67%
jan 1, 1981
308.79
+14.124
4.79%
jan 1, 1982
321.527
+12.738
4.13%
jan 1, 1983
324.509
+2.981
0.93%
jan 1, 1984
334.909
+10.401
3.21%
jan 1, 1985
342.818
+7.908
2.36%
jan 1, 1986
363.741
+20.924
6.1%
jan 1, 1987
365.719
+1.977
0.54%
jan 1, 1988
368.162
+2.444
0.67%
jan 1, 1989
385.255
+17.092
4.64%
jan 1, 1990
384.953
-0.302
-0.08%
jan 1, 1991
394.985
+10.032
2.61%
jan 1, 1992
406.253
+11.268
2.85%
jan 1, 1993
416.029
+9.776
2.41%
jan 1, 1994
415.477
-0.552
-0.13%
jan 1, 1995
500.638
+85.16
20.5%
jan 1, 1996
505.053
+4.415
0.88%
jan 1, 1997
528.325
+23.272
4.61%
jan 1, 1998
541.621
+13.297
2.52%
jan 1, 1999
554.291
+12.67
2.34%
jan 1, 2000
637.79
+83.499
15.06%
jan 1, 2001
618.482
-19.308
-3.03%
jan 1, 2002
633.001
+14.52
2.35%
jan 1, 2003
664.326
+31.325
4.95%
jan 1, 2004
658.142
-6.185
-0.93%
jan 1, 2005
642.178
-15.964
-2.43%
jan 1, 2006
632.368
-9.81
-1.53%
jan 1, 2007
626.665
-5.703
-0.9%
jan 1, 2008
632.572
+5.908
0.94%
jan 1, 2009
625.501
-7.071
-1.12%
Ranking of countries by current statistics by years


Comments: