29
/
en
AIzaSyAYiBZKx7MnpbEhh9jyipgxe19OcubqV5w
April 1, 2024
87669
Bolivia
BOL
true
2
1
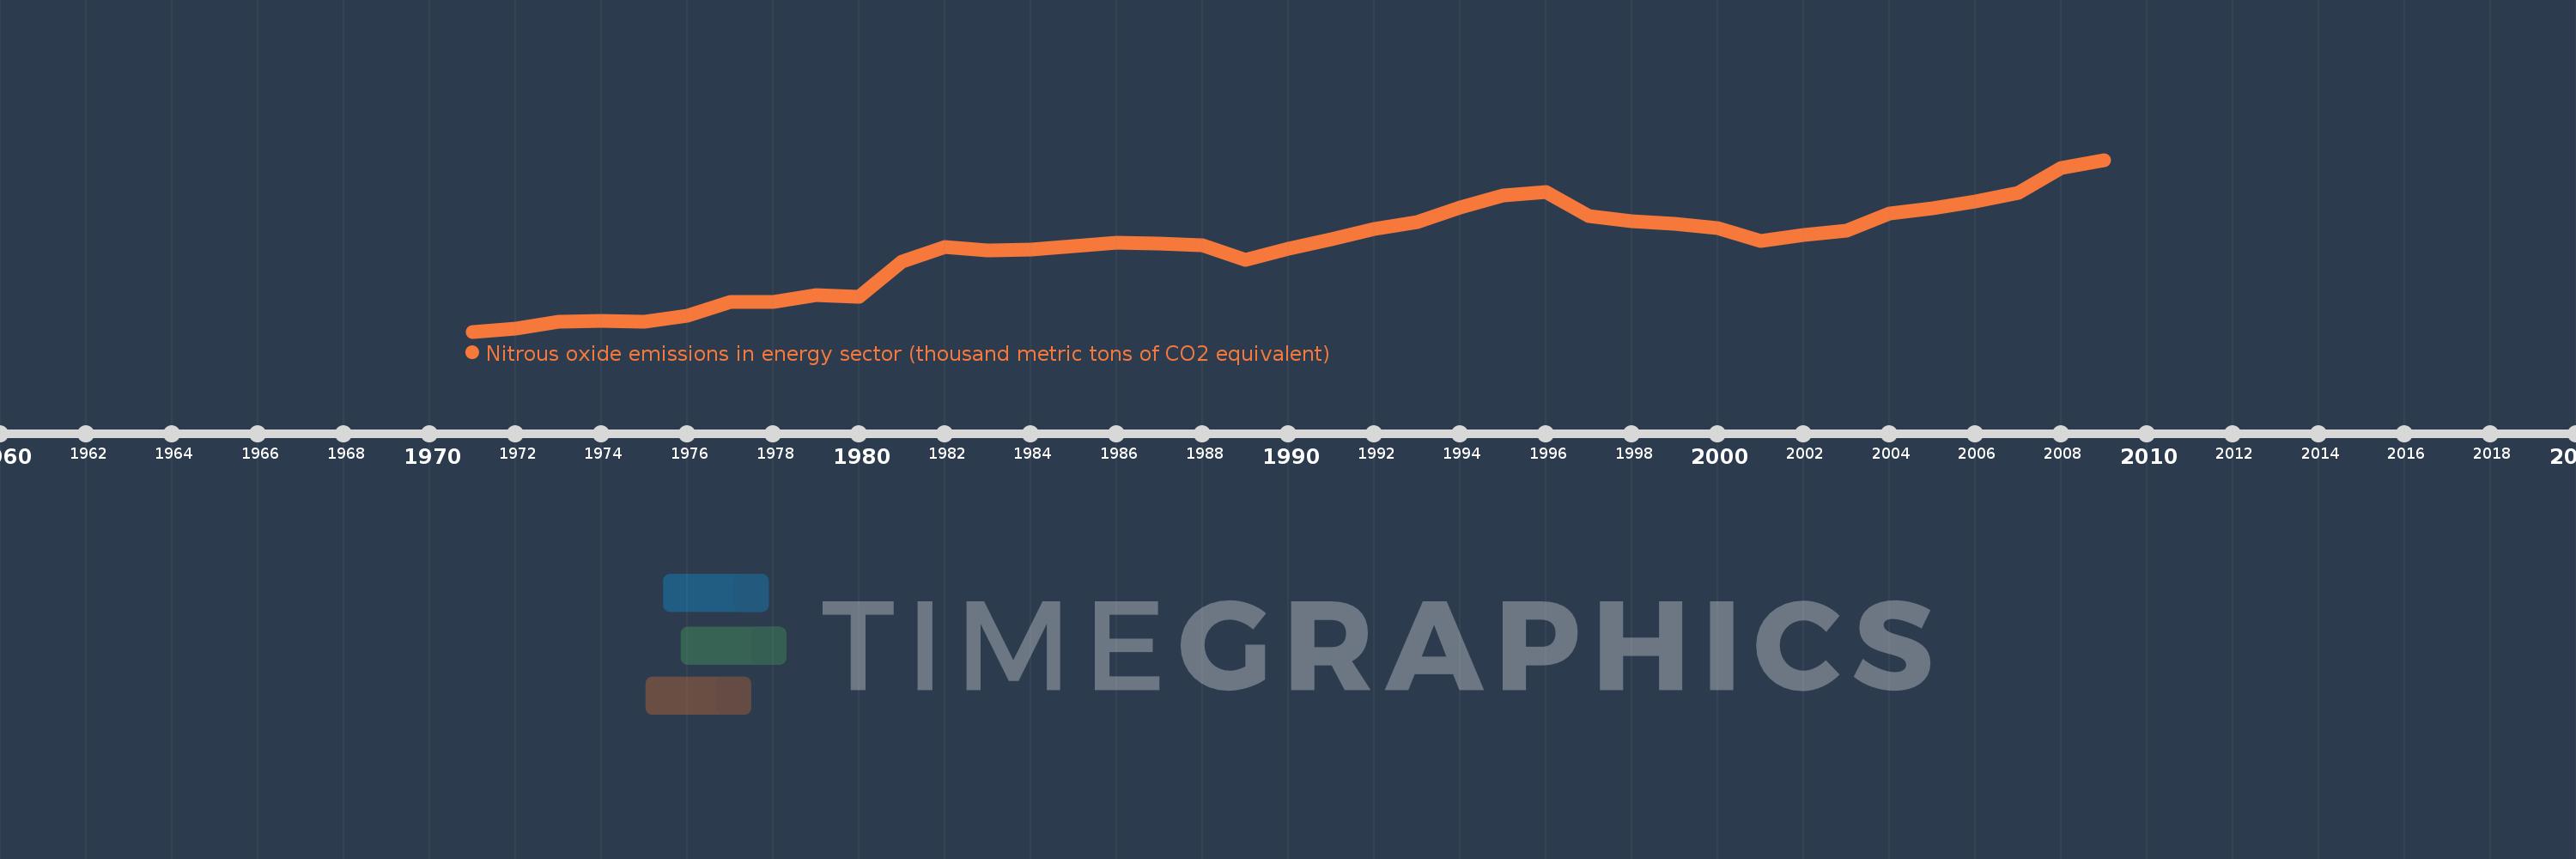
Nitrous oxide emissions in energy sector (thousand metric tons of CO2 equivalent)
2009,2008,2007,2006,2005,2004,2003,2002,2001,2000,1999,1998,1997,1996,1995,1994,1993,1992,1991,1990,1989,1988,1987,1986,1985,1984,1983,1982,1981,1980,1979,1978,1977,1976,1975,1974,1973,1972,1971
This statistics in other country:
AfghanistanAlbaniaAlgeriaAmerican SamoaAndorraAngolaAntigua and BarbudaArab WorldArgentinaArmeniaArubaAustraliaAustriaAzerbaijanBahamas, TheBahrainBangladeshBarbadosBelarusBelgiumBelizeBeninBermudaBhutanBoliviaBosnia and HerzegovinaBotswanaBrazilBritish Virgin IslandsBrunei DarussalamBulgariaBurkina FasoBurundiCabo VerdeCambodiaCameroonCanadaCaribbean small statesCayman IslandsCentral African RepublicCentral Europe and the BalticsChadChannel IslandsChileChinaColombiaComorosCongo, Dem. Rep.Congo, Rep.Costa RicaCote d'IvoireCroatiaCubaCuracaoCyprusCzech RepublicDenmarkDjiboutiDominicaDominican RepublicEarly-demographic dividendEast Asia & PacificEast Asia & Pacific (excluding high income)East Asia & Pacific (IDA & IBRD countries)EcuadorEgypt, Arab Rep.El SalvadorEquatorial GuineaEritreaEstoniaEthiopiaEuro areaEurope & Central AsiaEurope & Central Asia (excluding high income)Europe & Central Asia (IDA & IBRD countries)European UnionFaroe IslandsFijiFinlandFragile and conflict affected situationsFranceFrench PolynesiaGabonGambia, TheGeorgiaGermanyGhanaGibraltarGreeceGreenlandGrenadaGuamGuatemalaGuineaGuinea-BissauGuyanaHaitiHeavily indebted poor countries (HIPC)High incomeHondurasHong Kong SAR, ChinaHungaryIBRD onlyIcelandIDA & IBRD totalIDA blendIDA onlyIDA totalIndiaIndonesiaIran, Islamic Rep.IraqIrelandIsle of ManIsraelItalyJamaicaJapanJordanKazakhstanKenyaKiribatiKorea, Dem. People’s Rep.Korea, Rep.KosovoKuwaitKyrgyz RepublicLao PDRLate-demographic dividendLatin America & Caribbean Latin America & Caribbean (excluding high income)Latin America & the Caribbean (IDA & IBRD countries)LatviaLeast developed countries: UN classificationLebanonLesothoLiberiaLibyaLiechtensteinLithuaniaLow & middle incomeLow incomeLower middle incomeLuxembourgMacao SAR, ChinaMacedonia, FYRMadagascarMalawiMalaysiaMaldivesMaliMaltaMarshall IslandsMauritaniaMauritiusMexicoMicronesia, Fed. Sts.Middle East & North AfricaMiddle East & North Africa (excluding high income)Middle East & North Africa (IDA & IBRD countries)Middle incomeMoldovaMonacoMongoliaMontenegroMoroccoMozambiqueMyanmarNamibiaNauruNepalNetherlandsNew CaledoniaNew ZealandNicaraguaNigerNigeriaNorth AmericaNorthern Mariana IslandsNorwayOECD membersOmanOther small statesPacific island small statesPakistanPalauPanamaPapua New GuineaParaguayPeruPhilippinesPolandPortugalPost-demographic dividendPre-demographic dividendPuerto RicoQatarRomaniaRussian FederationRwandaSamoaSan MarinoSao Tome and PrincipeSaudi ArabiaSenegalSerbiaSeychellesSierra LeoneSingaporeSint Maarten (Dutch part)Slovak RepublicSloveniaSmall statesSolomon IslandsSomaliaSouth AfricaSouth AsiaSouth Asia (IDA & IBRD)South SudanSpainSri LankaSt. Kitts and NevisSt. LuciaSt. Martin (French part)St. Vincent and the GrenadinesSub-Saharan Africa Sub-Saharan Africa (excluding high income)Sub-Saharan Africa (IDA & IBRD countries)SudanSurinameSwazilandSwedenSwitzerlandSyrian Arab RepublicTajikistanTanzaniaThailandTimor-LesteTogoTongaTrinidad and TobagoTunisiaTurkeyTurkmenistanTurks and Caicos IslandsTuvaluUgandaUkraineUnited Arab EmiratesUnited KingdomUnited StatesUpper middle incomeUruguayUzbekistanVanuatuVenezuela, RBVietnamVirgin Islands (U.S.)West Bank and GazaWorldYemen, Rep.ZambiaZimbabwe Timeline:
This timeline shows a graph from 1971 to 2009 of Bolivia. No data until 1970. Number of actual observations by date: 39.
Source name:
World Development Indicators
Source organization:
European Commission, Joint Research Centre (JRC)/Netherlands Environmental Assessment Agency (PBL). Emission Database for Global Atmospheric Research (EDGAR): http://edgar.jrc.ec.europa.eu/
Categories, topics:
Energy & Mining, Environment
Last updated:
apr 23, 2017
Indicators value changes by year
Minimum:
29.065
jan 1, 1971
Maximum:
137.032
jan 1, 2009
At the date of observation
Value
Absolute change
Change from previous value
jan 1, 1971
29.065
+29.065
0.0%
jan 1, 1972
30.96
+1.895
6.52%
jan 1, 1973
35.042
+4.082
13.19%
jan 1, 1974
35.798
+0.756
2.16%
jan 1, 1975
35.035
-0.763
-2.13%
jan 1, 1976
39.146
+4.112
11.74%
jan 1, 1977
47.525
+8.379
21.4%
jan 1, 1978
47.713
+0.188
0.4%
jan 1, 1979
51.861
+4.148
8.69%
jan 1, 1980
50.851
-1.01
-1.95%
jan 1, 1981
73.308
+22.458
44.16%
jan 1, 1982
82.145
+8.837
12.06%
jan 1, 1983
80.141
-2.005
-2.44%
jan 1, 1984
80.725
+0.584
0.73%
jan 1, 1985
82.564
+1.84
2.28%
jan 1, 1986
84.684
+2.119
2.57%
jan 1, 1987
84.221
-0.462
-0.55%
jan 1, 1988
83.291
-0.93
-1.1%
jan 1, 1989
74.309
-8.982
-10.78%
jan 1, 1990
81.407
+7.098
9.55%
jan 1, 1991
86.882
+5.476
6.73%
jan 1, 1992
93.821
+6.938
7.99%
jan 1, 1993
97.808
+3.987
4.25%
jan 1, 1994
106.892
+9.084
9.29%
jan 1, 1995
114.871
+7.979
7.46%
jan 1, 1996
116.977
+2.106
1.83%
jan 1, 1997
101.814
-15.164
-12.96%
jan 1, 1998
98.609
-3.204
-3.15%
jan 1, 1999
96.564
-2.046
-2.07%
jan 1, 2000
94.277
-2.286
-2.37%
jan 1, 2001
85.828
-8.449
-8.96%
jan 1, 2002
89.841
+4.013
4.68%
jan 1, 2003
92.549
+2.708
3.01%
jan 1, 2004
103.213
+10.664
11.52%
jan 1, 2005
106.794
+3.581
3.47%
jan 1, 2006
111.013
+4.219
3.95%
jan 1, 2007
116.153
+5.14
4.63%
jan 1, 2008
132.017
+15.864
13.66%
jan 1, 2009
137.032
+5.015
3.8%
Ranking of countries by current statistics by years


Comments: