29
/
en
AIzaSyAYiBZKx7MnpbEhh9jyipgxe19OcubqV5w
April 1, 2024
268417
Tunisia
TUN
true
2
1
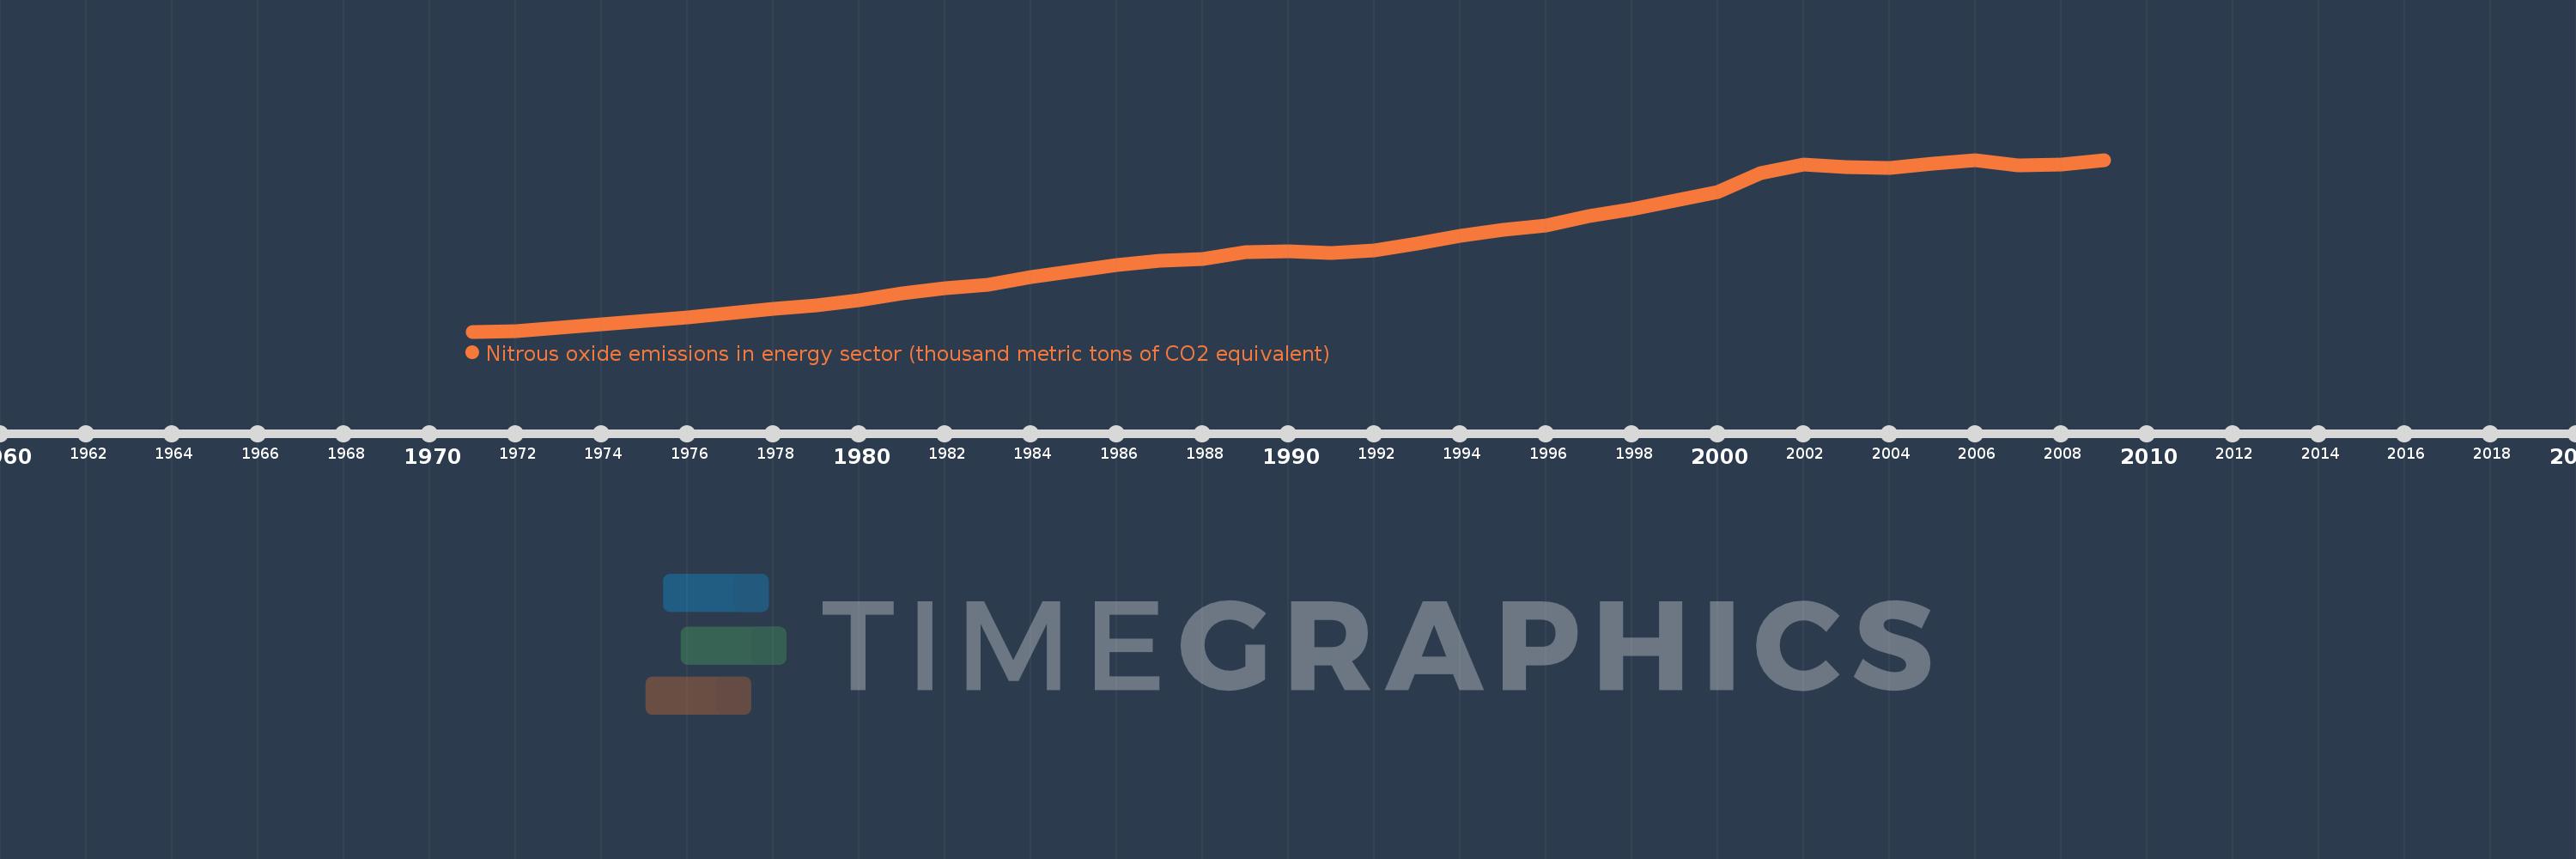
Nitrous oxide emissions in energy sector (thousand metric tons of CO2 equivalent)
2009,2008,2007,2006,2005,2004,2003,2002,2001,2000,1999,1998,1997,1996,1995,1994,1993,1992,1991,1990,1989,1988,1987,1986,1985,1984,1983,1982,1981,1980,1979,1978,1977,1976,1975,1974,1973,1972,1971
This statistics in other country:
AfghanistanAlbaniaAlgeriaAmerican SamoaAndorraAngolaAntigua and BarbudaArab WorldArgentinaArmeniaArubaAustraliaAustriaAzerbaijanBahamas, TheBahrainBangladeshBarbadosBelarusBelgiumBelizeBeninBermudaBhutanBoliviaBosnia and HerzegovinaBotswanaBrazilBritish Virgin IslandsBrunei DarussalamBulgariaBurkina FasoBurundiCabo VerdeCambodiaCameroonCanadaCaribbean small statesCayman IslandsCentral African RepublicCentral Europe and the BalticsChadChannel IslandsChileChinaColombiaComorosCongo, Dem. Rep.Congo, Rep.Costa RicaCote d'IvoireCroatiaCubaCuracaoCyprusCzech RepublicDenmarkDjiboutiDominicaDominican RepublicEarly-demographic dividendEast Asia & PacificEast Asia & Pacific (excluding high income)East Asia & Pacific (IDA & IBRD countries)EcuadorEgypt, Arab Rep.El SalvadorEquatorial GuineaEritreaEstoniaEthiopiaEuro areaEurope & Central AsiaEurope & Central Asia (excluding high income)Europe & Central Asia (IDA & IBRD countries)European UnionFaroe IslandsFijiFinlandFragile and conflict affected situationsFranceFrench PolynesiaGabonGambia, TheGeorgiaGermanyGhanaGibraltarGreeceGreenlandGrenadaGuamGuatemalaGuineaGuinea-BissauGuyanaHaitiHeavily indebted poor countries (HIPC)High incomeHondurasHong Kong SAR, ChinaHungaryIBRD onlyIcelandIDA & IBRD totalIDA blendIDA onlyIDA totalIndiaIndonesiaIran, Islamic Rep.IraqIrelandIsle of ManIsraelItalyJamaicaJapanJordanKazakhstanKenyaKiribatiKorea, Dem. People’s Rep.Korea, Rep.KosovoKuwaitKyrgyz RepublicLao PDRLate-demographic dividendLatin America & Caribbean Latin America & Caribbean (excluding high income)Latin America & the Caribbean (IDA & IBRD countries)LatviaLeast developed countries: UN classificationLebanonLesothoLiberiaLibyaLiechtensteinLithuaniaLow & middle incomeLow incomeLower middle incomeLuxembourgMacao SAR, ChinaMacedonia, FYRMadagascarMalawiMalaysiaMaldivesMaliMaltaMarshall IslandsMauritaniaMauritiusMexicoMicronesia, Fed. Sts.Middle East & North AfricaMiddle East & North Africa (excluding high income)Middle East & North Africa (IDA & IBRD countries)Middle incomeMoldovaMonacoMongoliaMontenegroMoroccoMozambiqueMyanmarNamibiaNauruNepalNetherlandsNew CaledoniaNew ZealandNicaraguaNigerNigeriaNorth AmericaNorthern Mariana IslandsNorwayOECD membersOmanOther small statesPacific island small statesPakistanPalauPanamaPapua New GuineaParaguayPeruPhilippinesPolandPortugalPost-demographic dividendPre-demographic dividendPuerto RicoQatarRomaniaRussian FederationRwandaSamoaSan MarinoSao Tome and PrincipeSaudi ArabiaSenegalSerbiaSeychellesSierra LeoneSingaporeSint Maarten (Dutch part)Slovak RepublicSloveniaSmall statesSolomon IslandsSomaliaSouth AfricaSouth AsiaSouth Asia (IDA & IBRD)South SudanSpainSri LankaSt. Kitts and NevisSt. LuciaSt. Martin (French part)St. Vincent and the GrenadinesSub-Saharan Africa Sub-Saharan Africa (excluding high income)Sub-Saharan Africa (IDA & IBRD countries)SudanSurinameSwazilandSwedenSwitzerlandSyrian Arab RepublicTajikistanTanzaniaThailandTimor-LesteTogoTongaTrinidad and TobagoTunisiaTurkeyTurkmenistanTurks and Caicos IslandsTuvaluUgandaUkraineUnited Arab EmiratesUnited KingdomUnited StatesUpper middle incomeUruguayUzbekistanVanuatuVenezuela, RBVietnamVirgin Islands (U.S.)West Bank and GazaWorldYemen, Rep.ZambiaZimbabwe Timeline:
This timeline shows a graph from 1971 to 2009 of Tunisia. No data until 1970. Number of actual observations by date: 39.
Source name:
World Development Indicators
Source organization:
European Commission, Joint Research Centre (JRC)/Netherlands Environmental Assessment Agency (PBL). Emission Database for Global Atmospheric Research (EDGAR): http://edgar.jrc.ec.europa.eu/
Categories, topics:
Energy & Mining, Environment
Last updated:
apr 23, 2017
Indicators value changes by year
Minimum:
78.894
jan 1, 1971
Maximum:
214.467
jan 1, 2006
At the date of observation
Value
Absolute change
Change from previous value
jan 1, 1971
78.894
+78.894
0.0%
jan 1, 1972
79.174
+0.28
0.36%
jan 1, 1973
81.884
+2.71
3.42%
jan 1, 1974
84.512
+2.627
3.21%
jan 1, 1975
87.381
+2.869
3.4%
jan 1, 1976
90.231
+2.85
3.26%
jan 1, 1977
93.172
+2.941
3.26%
jan 1, 1978
97.149
+3.976
4.27%
jan 1, 1979
99.306
+2.157
2.22%
jan 1, 1980
103.822
+4.516
4.55%
jan 1, 1981
108.864
+5.042
4.86%
jan 1, 1982
113.187
+4.323
3.97%
jan 1, 1983
115.909
+2.721
2.4%
jan 1, 1984
121.742
+5.834
5.03%
jan 1, 1985
126.525
+4.783
3.93%
jan 1, 1986
131.156
+4.631
3.66%
jan 1, 1987
135.088
+3.932
3.0%
jan 1, 1988
135.974
+0.885
0.66%
jan 1, 1989
141.791
+5.817
4.28%
jan 1, 1990
142.511
+0.72
0.51%
jan 1, 1991
141.03
-1.481
-1.04%
jan 1, 1992
143.206
+2.176
1.54%
jan 1, 1993
148.544
+5.338
3.73%
jan 1, 1994
154.724
+6.18
4.16%
jan 1, 1995
159.494
+4.77
3.08%
jan 1, 1996
162.724
+3.23
2.02%
jan 1, 1997
169.871
+7.147
4.39%
jan 1, 1998
175.775
+5.904
3.48%
jan 1, 1999
182.069
+6.294
3.58%
jan 1, 2000
189.311
+7.242
3.98%
jan 1, 2001
203.731
+14.42
7.62%
jan 1, 2002
211.016
+7.285
3.58%
jan 1, 2003
208.904
-2.112
-1.0%
jan 1, 2004
208.162
-0.743
-0.36%
jan 1, 2005
211.084
+2.922
1.4%
jan 1, 2006
214.467
+3.383
1.6%
jan 1, 2007
210.126
-4.341
-2.02%
jan 1, 2008
210.953
+0.827
0.39%
jan 1, 2009
214.308
+3.355
1.59%
Ranking of countries by current statistics by years


Comments: