29
/
en
AIzaSyAYiBZKx7MnpbEhh9jyipgxe19OcubqV5w
April 1, 2024
250169
St. Kitts and Nevis
KNA
true
2
1
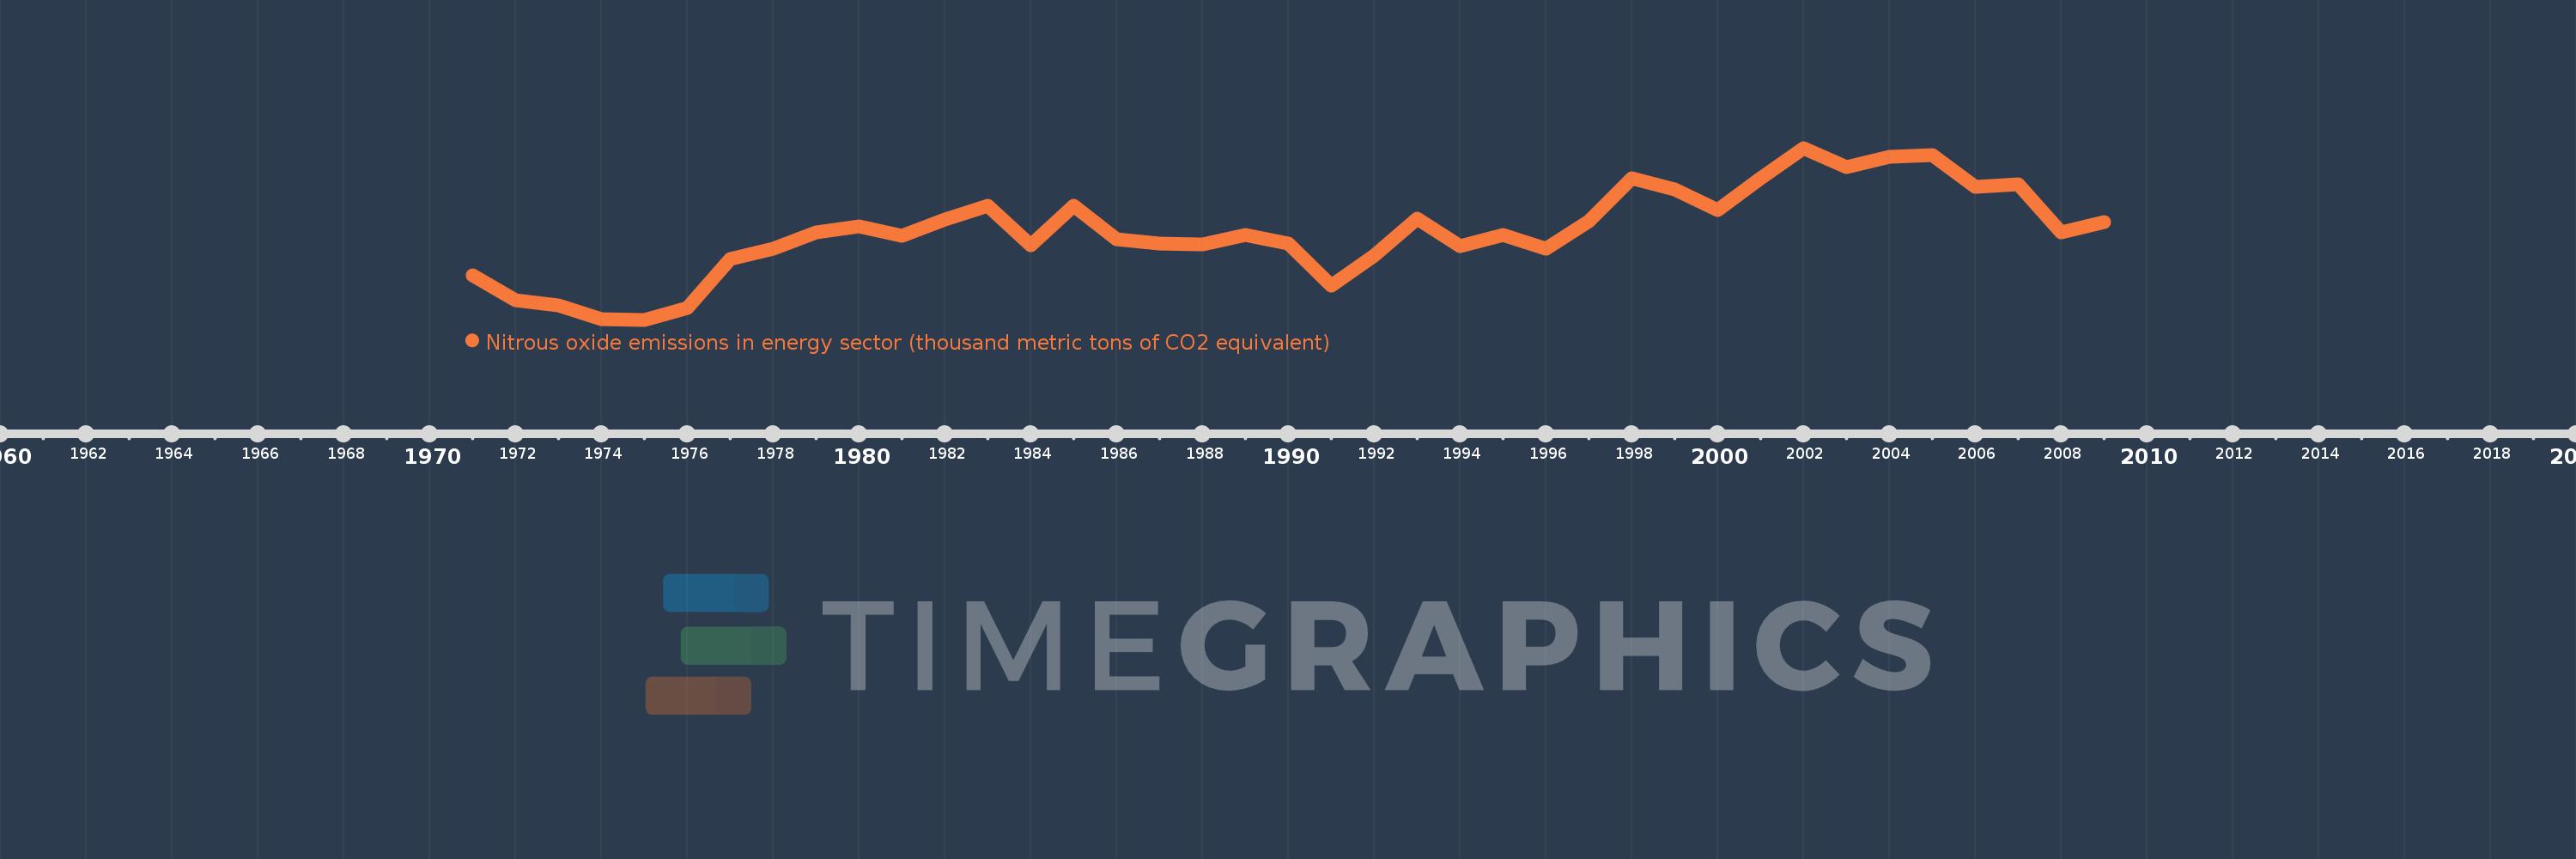
Nitrous oxide emissions in energy sector (thousand metric tons of CO2 equivalent)
2009,2008,2007,2006,2005,2004,2003,2002,2001,2000,1999,1998,1997,1996,1995,1994,1993,1992,1991,1990,1989,1988,1987,1986,1985,1984,1983,1982,1981,1980,1979,1978,1977,1976,1975,1974,1973,1972,1971
This statistics in other country:
AfghanistanAlbaniaAlgeriaAmerican SamoaAndorraAngolaAntigua and BarbudaArab WorldArgentinaArmeniaArubaAustraliaAustriaAzerbaijanBahamas, TheBahrainBangladeshBarbadosBelarusBelgiumBelizeBeninBermudaBhutanBoliviaBosnia and HerzegovinaBotswanaBrazilBritish Virgin IslandsBrunei DarussalamBulgariaBurkina FasoBurundiCabo VerdeCambodiaCameroonCanadaCaribbean small statesCayman IslandsCentral African RepublicCentral Europe and the BalticsChadChannel IslandsChileChinaColombiaComorosCongo, Dem. Rep.Congo, Rep.Costa RicaCote d'IvoireCroatiaCubaCuracaoCyprusCzech RepublicDenmarkDjiboutiDominicaDominican RepublicEarly-demographic dividendEast Asia & PacificEast Asia & Pacific (excluding high income)East Asia & Pacific (IDA & IBRD countries)EcuadorEgypt, Arab Rep.El SalvadorEquatorial GuineaEritreaEstoniaEthiopiaEuro areaEurope & Central AsiaEurope & Central Asia (excluding high income)Europe & Central Asia (IDA & IBRD countries)European UnionFaroe IslandsFijiFinlandFragile and conflict affected situationsFranceFrench PolynesiaGabonGambia, TheGeorgiaGermanyGhanaGibraltarGreeceGreenlandGrenadaGuamGuatemalaGuineaGuinea-BissauGuyanaHaitiHeavily indebted poor countries (HIPC)High incomeHondurasHong Kong SAR, ChinaHungaryIBRD onlyIcelandIDA & IBRD totalIDA blendIDA onlyIDA totalIndiaIndonesiaIran, Islamic Rep.IraqIrelandIsle of ManIsraelItalyJamaicaJapanJordanKazakhstanKenyaKiribatiKorea, Dem. People’s Rep.Korea, Rep.KosovoKuwaitKyrgyz RepublicLao PDRLate-demographic dividendLatin America & Caribbean Latin America & Caribbean (excluding high income)Latin America & the Caribbean (IDA & IBRD countries)LatviaLeast developed countries: UN classificationLebanonLesothoLiberiaLibyaLiechtensteinLithuaniaLow & middle incomeLow incomeLower middle incomeLuxembourgMacao SAR, ChinaMacedonia, FYRMadagascarMalawiMalaysiaMaldivesMaliMaltaMarshall IslandsMauritaniaMauritiusMexicoMicronesia, Fed. Sts.Middle East & North AfricaMiddle East & North Africa (excluding high income)Middle East & North Africa (IDA & IBRD countries)Middle incomeMoldovaMonacoMongoliaMontenegroMoroccoMozambiqueMyanmarNamibiaNauruNepalNetherlandsNew CaledoniaNew ZealandNicaraguaNigerNigeriaNorth AmericaNorthern Mariana IslandsNorwayOECD membersOmanOther small statesPacific island small statesPakistanPalauPanamaPapua New GuineaParaguayPeruPhilippinesPolandPortugalPost-demographic dividendPre-demographic dividendPuerto RicoQatarRomaniaRussian FederationRwandaSamoaSan MarinoSao Tome and PrincipeSaudi ArabiaSenegalSerbiaSeychellesSierra LeoneSingaporeSint Maarten (Dutch part)Slovak RepublicSloveniaSmall statesSolomon IslandsSomaliaSouth AfricaSouth AsiaSouth Asia (IDA & IBRD)South SudanSpainSri LankaSt. Kitts and NevisSt. LuciaSt. Martin (French part)St. Vincent and the GrenadinesSub-Saharan Africa Sub-Saharan Africa (excluding high income)Sub-Saharan Africa (IDA & IBRD countries)SudanSurinameSwazilandSwedenSwitzerlandSyrian Arab RepublicTajikistanTanzaniaThailandTimor-LesteTogoTongaTrinidad and TobagoTunisiaTurkeyTurkmenistanTurks and Caicos IslandsTuvaluUgandaUkraineUnited Arab EmiratesUnited KingdomUnited StatesUpper middle incomeUruguayUzbekistanVanuatuVenezuela, RBVietnamVirgin Islands (U.S.)West Bank and GazaWorldYemen, Rep.ZambiaZimbabwe Timeline:
This timeline shows a graph from 1971 to 2009 of St. Kitts and Nevis. No data until 1970. Number of actual observations by date: 39.
Source name:
World Development Indicators
Source organization:
European Commission, Joint Research Centre (JRC)/Netherlands Environmental Assessment Agency (PBL). Emission Database for Global Atmospheric Research (EDGAR): http://edgar.jrc.ec.europa.eu/
Categories, topics:
Energy & Mining, Environment
Last updated:
apr 23, 2017
Indicators value changes by year
At the date of observation
Value
Absolute change
Change from previous value
jan 1, 1971
0.954
+0.954
0.0%
jan 1, 1972
0.855
-0.1
-10.43%
jan 1, 1973
0.837
-0.018
-2.09%
jan 1, 1974
0.781
-0.056
-6.65%
jan 1, 1975
0.779
-0.002
-0.26%
jan 1, 1976
0.826
+0.047
6.05%
jan 1, 1977
1.019
+0.193
23.32%
jan 1, 1978
1.06
+0.041
4.06%
jan 1, 1979
1.125
+0.064
6.04%
jan 1, 1980
1.146
+0.021
1.87%
jan 1, 1981
1.109
-0.037
-3.24%
jan 1, 1982
1.174
+0.065
5.9%
jan 1, 1983
1.229
+0.055
4.65%
jan 1, 1984
1.074
-0.155
-12.6%
jan 1, 1985
1.228
+0.154
14.35%
jan 1, 1986
1.096
-0.131
-10.71%
jan 1, 1987
1.078
-0.018
-1.68%
jan 1, 1988
1.075
-0.003
-0.26%
jan 1, 1989
1.115
+0.04
3.74%
jan 1, 1990
1.081
-0.034
-3.06%
jan 1, 1991
0.915
-0.166
-15.39%
jan 1, 1992
1.031
+0.116
12.7%
jan 1, 1993
1.178
+0.147
14.25%
jan 1, 1994
1.068
-0.11
-9.3%
jan 1, 1995
1.113
+0.044
4.16%
jan 1, 1996
1.06
-0.053
-4.78%
jan 1, 1997
1.169
+0.11
10.34%
jan 1, 1998
1.336
+0.167
14.3%
jan 1, 1999
1.292
-0.045
-3.34%
jan 1, 2000
1.211
-0.08
-6.22%
jan 1, 2001
1.337
+0.125
10.36%
jan 1, 2002
1.457
+0.12
9.01%
jan 1, 2003
1.38
-0.077
-5.29%
jan 1, 2004
1.423
+0.043
3.11%
jan 1, 2005
1.429
+0.006
0.44%
jan 1, 2006
1.303
-0.126
-8.83%
jan 1, 2007
1.314
+0.011
0.83%
jan 1, 2008
1.123
-0.19
-14.5%
jan 1, 2009
1.165
+0.041
3.68%
Ranking of countries by current statistics by years


Comments: