29
/
en
AIzaSyAYiBZKx7MnpbEhh9jyipgxe19OcubqV5w
April 1, 2024
142144
Greece
GRC
true
2
1
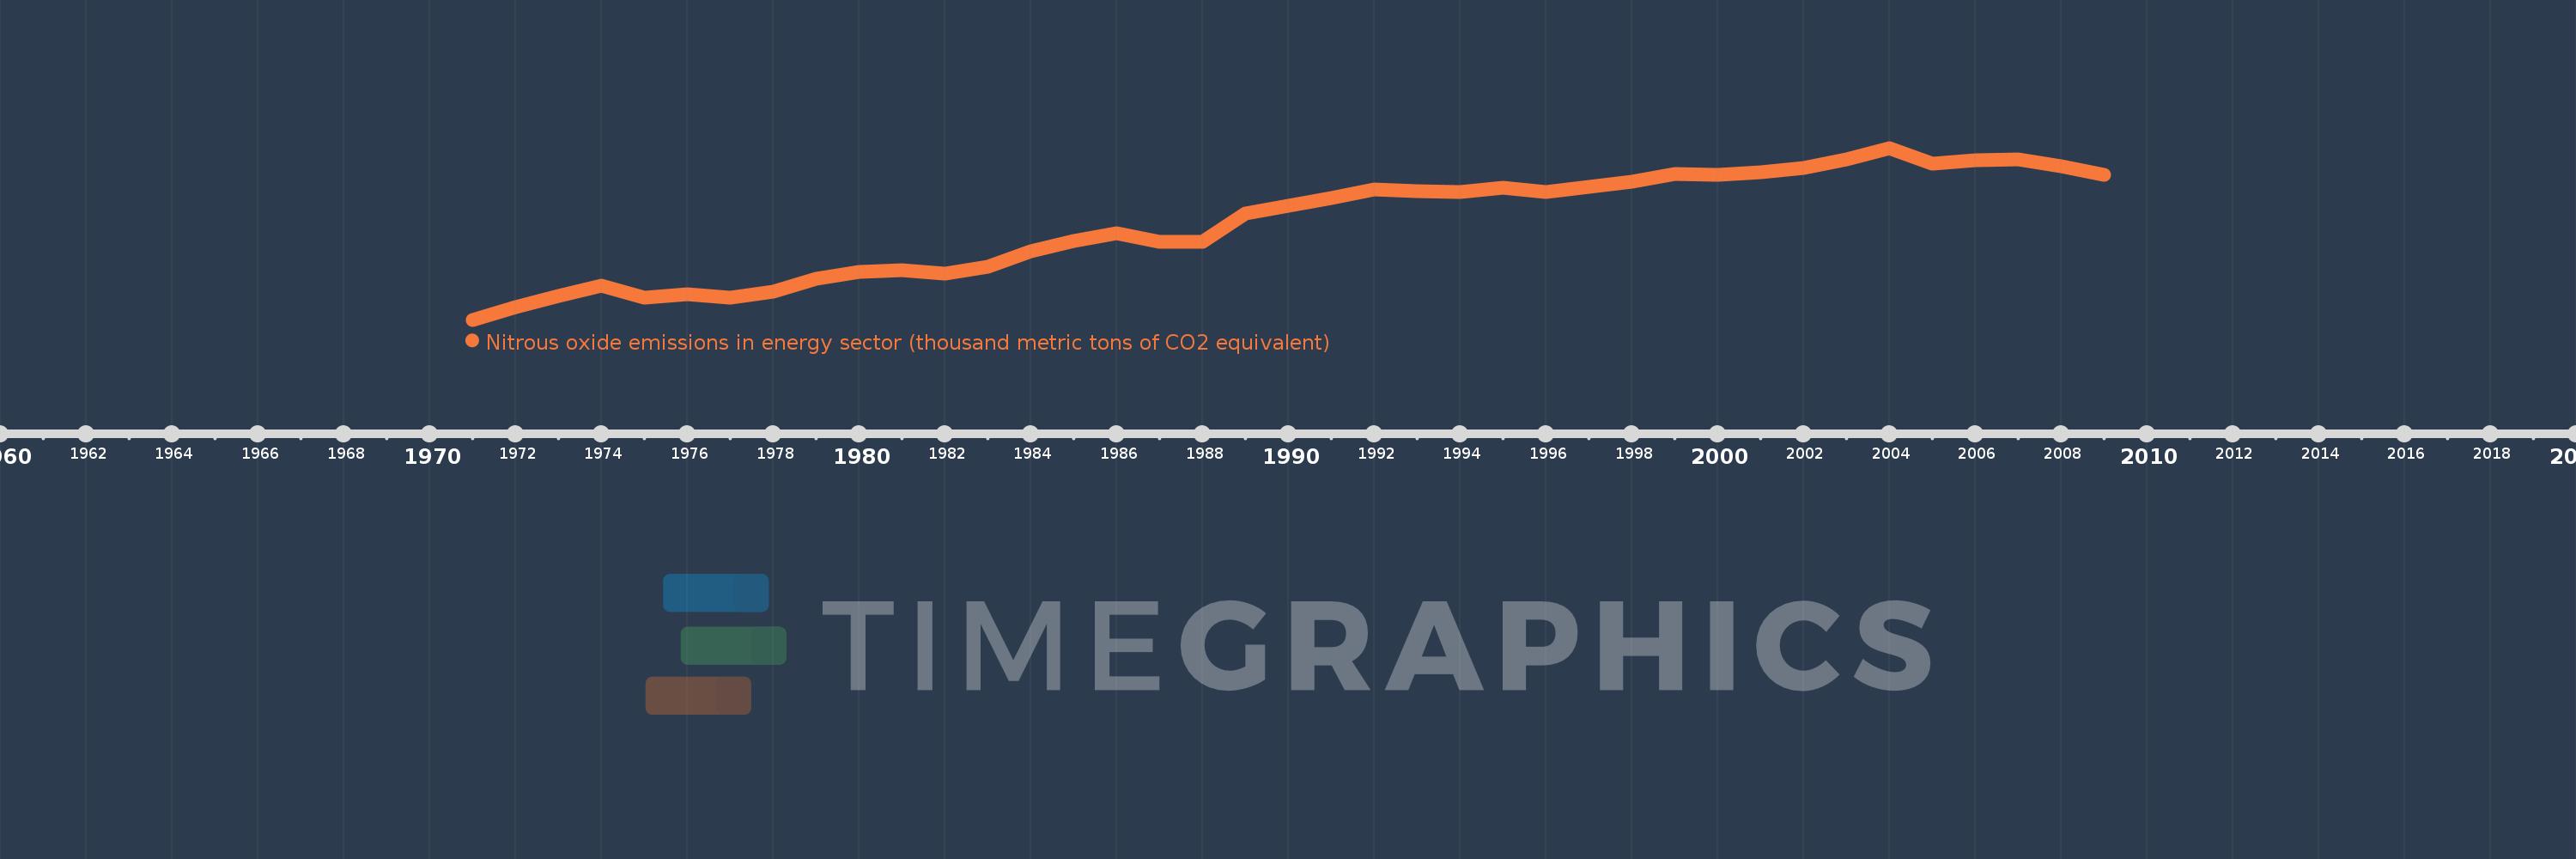
Nitrous oxide emissions in energy sector (thousand metric tons of CO2 equivalent)
2009,2008,2007,2006,2005,2004,2003,2002,2001,2000,1999,1998,1997,1996,1995,1994,1993,1992,1991,1990,1989,1988,1987,1986,1985,1984,1983,1982,1981,1980,1979,1978,1977,1976,1975,1974,1973,1972,1971
This statistics in other country:
AfghanistanAlbaniaAlgeriaAmerican SamoaAndorraAngolaAntigua and BarbudaArab WorldArgentinaArmeniaArubaAustraliaAustriaAzerbaijanBahamas, TheBahrainBangladeshBarbadosBelarusBelgiumBelizeBeninBermudaBhutanBoliviaBosnia and HerzegovinaBotswanaBrazilBritish Virgin IslandsBrunei DarussalamBulgariaBurkina FasoBurundiCabo VerdeCambodiaCameroonCanadaCaribbean small statesCayman IslandsCentral African RepublicCentral Europe and the BalticsChadChannel IslandsChileChinaColombiaComorosCongo, Dem. Rep.Congo, Rep.Costa RicaCote d'IvoireCroatiaCubaCuracaoCyprusCzech RepublicDenmarkDjiboutiDominicaDominican RepublicEarly-demographic dividendEast Asia & PacificEast Asia & Pacific (excluding high income)East Asia & Pacific (IDA & IBRD countries)EcuadorEgypt, Arab Rep.El SalvadorEquatorial GuineaEritreaEstoniaEthiopiaEuro areaEurope & Central AsiaEurope & Central Asia (excluding high income)Europe & Central Asia (IDA & IBRD countries)European UnionFaroe IslandsFijiFinlandFragile and conflict affected situationsFranceFrench PolynesiaGabonGambia, TheGeorgiaGermanyGhanaGibraltarGreeceGreenlandGrenadaGuamGuatemalaGuineaGuinea-BissauGuyanaHaitiHeavily indebted poor countries (HIPC)High incomeHondurasHong Kong SAR, ChinaHungaryIBRD onlyIcelandIDA & IBRD totalIDA blendIDA onlyIDA totalIndiaIndonesiaIran, Islamic Rep.IraqIrelandIsle of ManIsraelItalyJamaicaJapanJordanKazakhstanKenyaKiribatiKorea, Dem. People’s Rep.Korea, Rep.KosovoKuwaitKyrgyz RepublicLao PDRLate-demographic dividendLatin America & Caribbean Latin America & Caribbean (excluding high income)Latin America & the Caribbean (IDA & IBRD countries)LatviaLeast developed countries: UN classificationLebanonLesothoLiberiaLibyaLiechtensteinLithuaniaLow & middle incomeLow incomeLower middle incomeLuxembourgMacao SAR, ChinaMacedonia, FYRMadagascarMalawiMalaysiaMaldivesMaliMaltaMarshall IslandsMauritaniaMauritiusMexicoMicronesia, Fed. Sts.Middle East & North AfricaMiddle East & North Africa (excluding high income)Middle East & North Africa (IDA & IBRD countries)Middle incomeMoldovaMonacoMongoliaMontenegroMoroccoMozambiqueMyanmarNamibiaNauruNepalNetherlandsNew CaledoniaNew ZealandNicaraguaNigerNigeriaNorth AmericaNorthern Mariana IslandsNorwayOECD membersOmanOther small statesPacific island small statesPakistanPalauPanamaPapua New GuineaParaguayPeruPhilippinesPolandPortugalPost-demographic dividendPre-demographic dividendPuerto RicoQatarRomaniaRussian FederationRwandaSamoaSan MarinoSao Tome and PrincipeSaudi ArabiaSenegalSerbiaSeychellesSierra LeoneSingaporeSint Maarten (Dutch part)Slovak RepublicSloveniaSmall statesSolomon IslandsSomaliaSouth AfricaSouth AsiaSouth Asia (IDA & IBRD)South SudanSpainSri LankaSt. Kitts and NevisSt. LuciaSt. Martin (French part)St. Vincent and the GrenadinesSub-Saharan Africa Sub-Saharan Africa (excluding high income)Sub-Saharan Africa (IDA & IBRD countries)SudanSurinameSwazilandSwedenSwitzerlandSyrian Arab RepublicTajikistanTanzaniaThailandTimor-LesteTogoTongaTrinidad and TobagoTunisiaTurkeyTurkmenistanTurks and Caicos IslandsTuvaluUgandaUkraineUnited Arab EmiratesUnited KingdomUnited StatesUpper middle incomeUruguayUzbekistanVanuatuVenezuela, RBVietnamVirgin Islands (U.S.)West Bank and GazaWorldYemen, Rep.ZambiaZimbabwe Timeline:
This timeline shows a graph from 1971 to 2009 of Greece. No data until 1970. Number of actual observations by date: 39.
Source name:
World Development Indicators
Source organization:
European Commission, Joint Research Centre (JRC)/Netherlands Environmental Assessment Agency (PBL). Emission Database for Global Atmospheric Research (EDGAR): http://edgar.jrc.ec.europa.eu/
Categories, topics:
Energy & Mining, Environment
Last updated:
apr 23, 2017
Indicators value changes by year
Minimum:
304.06
jan 1, 1971
Maximum:
891.101
jan 1, 2004
At the date of observation
Value
Absolute change
Change from previous value
jan 1, 1971
304.06
+304.06
0.0%
jan 1, 1972
346.577
+42.517
13.98%
jan 1, 1973
386.054
+39.477
11.39%
jan 1, 1974
419.527
+33.473
8.67%
jan 1, 1975
380.501
-39.026
-9.3%
jan 1, 1976
391.787
+11.286
2.97%
jan 1, 1977
379.454
-12.333
-3.15%
jan 1, 1978
400.982
+21.527
5.67%
jan 1, 1979
444.0
+43.019
10.73%
jan 1, 1980
467.585
+23.584
5.31%
jan 1, 1981
474.411
+6.826
1.46%
jan 1, 1982
460.586
-13.825
-2.91%
jan 1, 1983
484.438
+23.852
5.18%
jan 1, 1984
538.937
+54.5
11.25%
jan 1, 1985
573.219
+34.281
6.36%
jan 1, 1986
599.019
+25.8
4.5%
jan 1, 1987
570.632
-28.387
-4.74%
jan 1, 1988
571.212
+0.58
0.1%
jan 1, 1989
666.616
+95.404
16.7%
jan 1, 1990
693.393
+26.777
4.02%
jan 1, 1991
719.999
+26.606
3.84%
jan 1, 1992
749.934
+29.935
4.16%
jan 1, 1993
742.169
-7.765
-1.04%
jan 1, 1994
741.444
-0.725
-0.1%
jan 1, 1995
754.445
+13.001
1.75%
jan 1, 1996
739.866
-14.579
-1.93%
jan 1, 1997
757.528
+17.662
2.39%
jan 1, 1998
776.593
+19.065
2.52%
jan 1, 1999
801.25
+24.657
3.18%
jan 1, 2000
798.927
-2.323
-0.29%
jan 1, 2001
807.595
+8.668
1.08%
jan 1, 2002
821.361
+13.766
1.7%
jan 1, 2003
851.451
+30.09
3.66%
jan 1, 2004
891.101
+39.65
4.66%
jan 1, 2005
836.558
-54.543
-6.12%
jan 1, 2006
850.152
+13.594
1.63%
jan 1, 2007
850.626
+0.474
0.06%
jan 1, 2008
829.382
-21.244
-2.5%
jan 1, 2009
799.282
-30.1
-3.63%
Ranking of countries by current statistics by years


Comments: