29
/
en
AIzaSyAYiBZKx7MnpbEhh9jyipgxe19OcubqV5w
April 1, 2024
204472
Myanmar
MMR
true
2
1
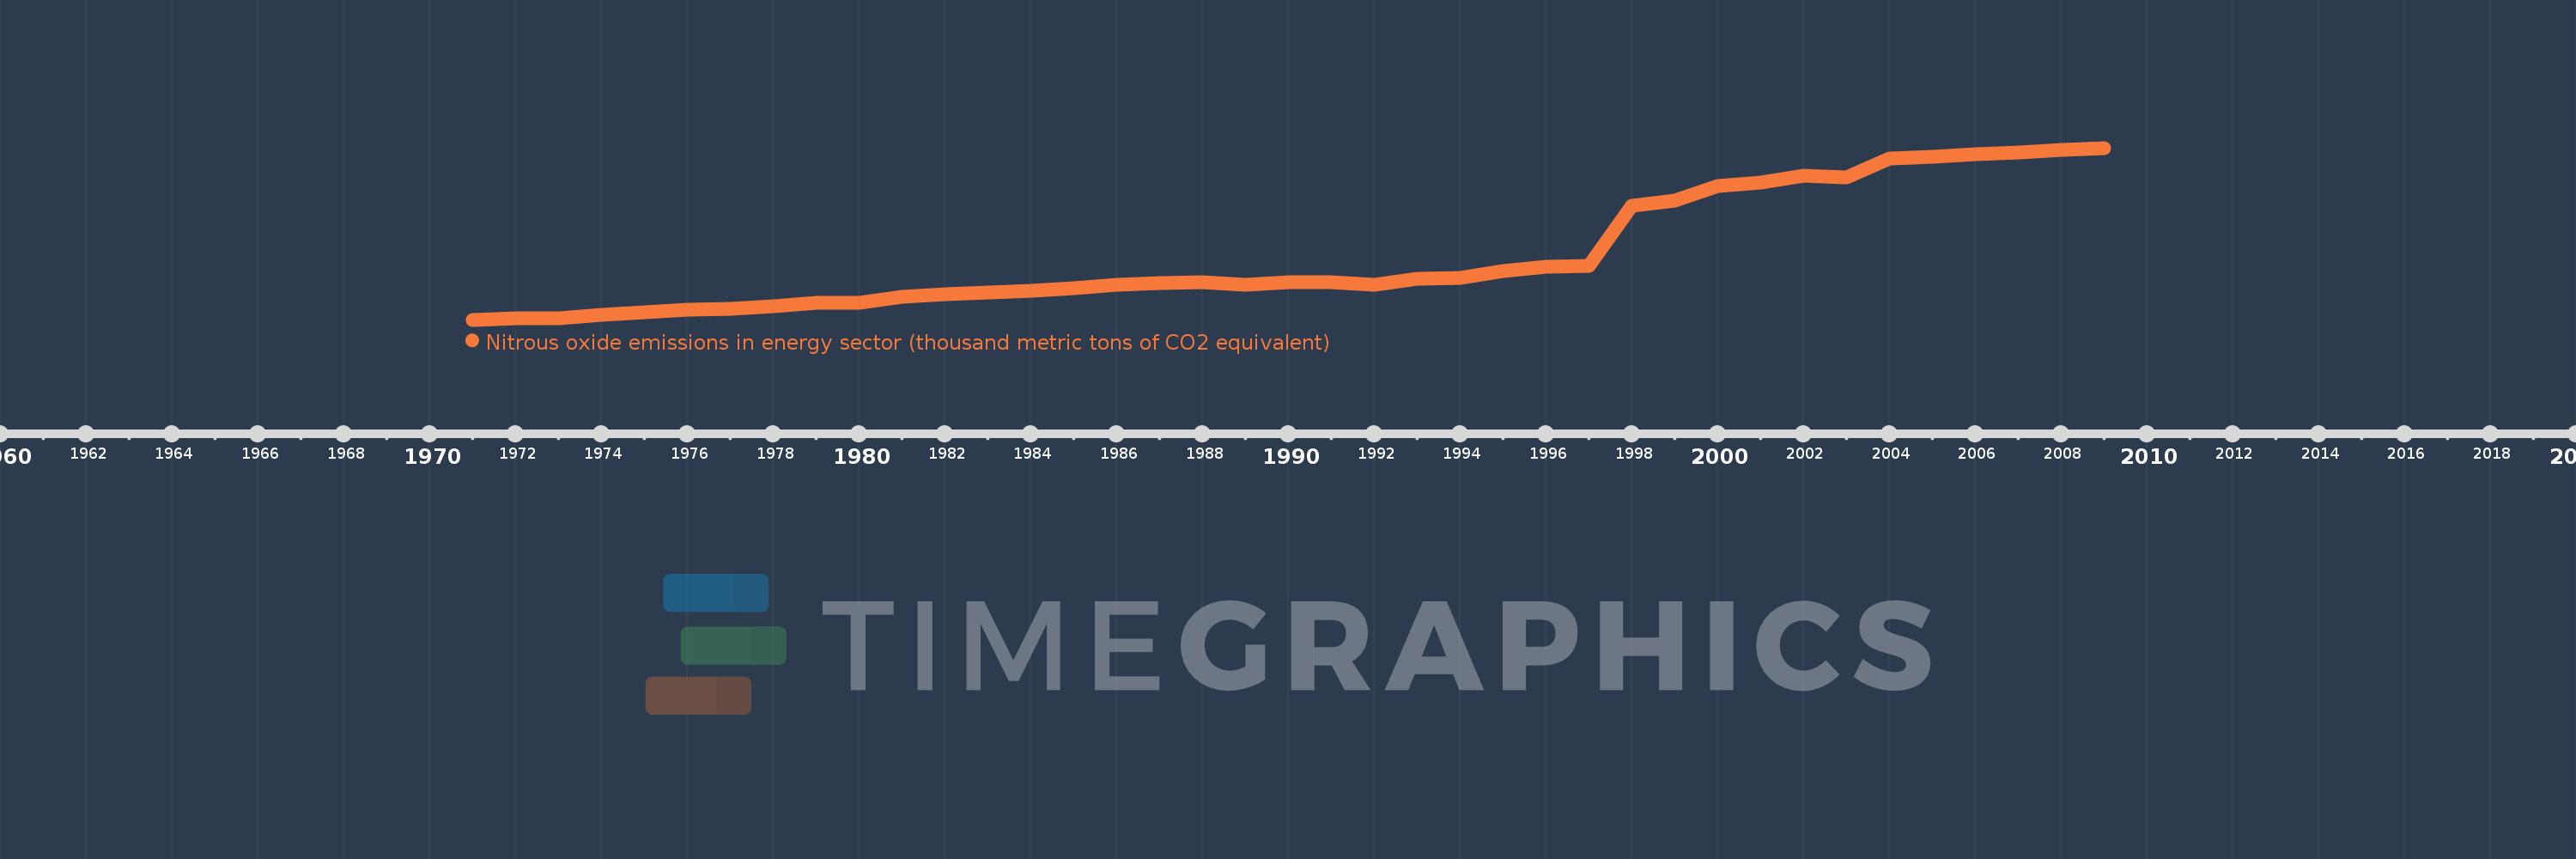
Nitrous oxide emissions in energy sector (thousand metric tons of CO2 equivalent)
2009,2008,2007,2006,2005,2004,2003,2002,2001,2000,1999,1998,1997,1996,1995,1994,1993,1992,1991,1990,1989,1988,1987,1986,1985,1984,1983,1982,1981,1980,1979,1978,1977,1976,1975,1974,1973,1972,1971
This statistics in other country:
AfghanistanAlbaniaAlgeriaAmerican SamoaAndorraAngolaAntigua and BarbudaArab WorldArgentinaArmeniaArubaAustraliaAustriaAzerbaijanBahamas, TheBahrainBangladeshBarbadosBelarusBelgiumBelizeBeninBermudaBhutanBoliviaBosnia and HerzegovinaBotswanaBrazilBritish Virgin IslandsBrunei DarussalamBulgariaBurkina FasoBurundiCabo VerdeCambodiaCameroonCanadaCaribbean small statesCayman IslandsCentral African RepublicCentral Europe and the BalticsChadChannel IslandsChileChinaColombiaComorosCongo, Dem. Rep.Congo, Rep.Costa RicaCote d'IvoireCroatiaCubaCuracaoCyprusCzech RepublicDenmarkDjiboutiDominicaDominican RepublicEarly-demographic dividendEast Asia & PacificEast Asia & Pacific (excluding high income)East Asia & Pacific (IDA & IBRD countries)EcuadorEgypt, Arab Rep.El SalvadorEquatorial GuineaEritreaEstoniaEthiopiaEuro areaEurope & Central AsiaEurope & Central Asia (excluding high income)Europe & Central Asia (IDA & IBRD countries)European UnionFaroe IslandsFijiFinlandFragile and conflict affected situationsFranceFrench PolynesiaGabonGambia, TheGeorgiaGermanyGhanaGibraltarGreeceGreenlandGrenadaGuamGuatemalaGuineaGuinea-BissauGuyanaHaitiHeavily indebted poor countries (HIPC)High incomeHondurasHong Kong SAR, ChinaHungaryIBRD onlyIcelandIDA & IBRD totalIDA blendIDA onlyIDA totalIndiaIndonesiaIran, Islamic Rep.IraqIrelandIsle of ManIsraelItalyJamaicaJapanJordanKazakhstanKenyaKiribatiKorea, Dem. People’s Rep.Korea, Rep.KosovoKuwaitKyrgyz RepublicLao PDRLate-demographic dividendLatin America & Caribbean Latin America & Caribbean (excluding high income)Latin America & the Caribbean (IDA & IBRD countries)LatviaLeast developed countries: UN classificationLebanonLesothoLiberiaLibyaLiechtensteinLithuaniaLow & middle incomeLow incomeLower middle incomeLuxembourgMacao SAR, ChinaMacedonia, FYRMadagascarMalawiMalaysiaMaldivesMaliMaltaMarshall IslandsMauritaniaMauritiusMexicoMicronesia, Fed. Sts.Middle East & North AfricaMiddle East & North Africa (excluding high income)Middle East & North Africa (IDA & IBRD countries)Middle incomeMoldovaMonacoMongoliaMontenegroMoroccoMozambiqueMyanmarNamibiaNauruNepalNetherlandsNew CaledoniaNew ZealandNicaraguaNigerNigeriaNorth AmericaNorthern Mariana IslandsNorwayOECD membersOmanOther small statesPacific island small statesPakistanPalauPanamaPapua New GuineaParaguayPeruPhilippinesPolandPortugalPost-demographic dividendPre-demographic dividendPuerto RicoQatarRomaniaRussian FederationRwandaSamoaSan MarinoSao Tome and PrincipeSaudi ArabiaSenegalSerbiaSeychellesSierra LeoneSingaporeSint Maarten (Dutch part)Slovak RepublicSloveniaSmall statesSolomon IslandsSomaliaSouth AfricaSouth AsiaSouth Asia (IDA & IBRD)South SudanSpainSri LankaSt. Kitts and NevisSt. LuciaSt. Martin (French part)St. Vincent and the GrenadinesSub-Saharan Africa Sub-Saharan Africa (excluding high income)Sub-Saharan Africa (IDA & IBRD countries)SudanSurinameSwazilandSwedenSwitzerlandSyrian Arab RepublicTajikistanTanzaniaThailandTimor-LesteTogoTongaTrinidad and TobagoTunisiaTurkeyTurkmenistanTurks and Caicos IslandsTuvaluUgandaUkraineUnited Arab EmiratesUnited KingdomUnited StatesUpper middle incomeUruguayUzbekistanVanuatuVenezuela, RBVietnamVirgin Islands (U.S.)West Bank and GazaWorldYemen, Rep.ZambiaZimbabwe Timeline:
This timeline shows a graph from 1971 to 2009 of Myanmar. No data until 1970. Number of actual observations by date: 39.
Source name:
World Development Indicators
Source organization:
European Commission, Joint Research Centre (JRC)/Netherlands Environmental Assessment Agency (PBL). Emission Database for Global Atmospheric Research (EDGAR): http://edgar.jrc.ec.europa.eu/
Categories, topics:
Energy & Mining, Environment
Last updated:
apr 23, 2017
Indicators value changes by year
Minimum:
293.109
jan 1, 1971
Maximum:
813.901
jan 1, 2009
At the date of observation
Value
Absolute change
Change from previous value
jan 1, 1971
293.109
+293.109
0.0%
jan 1, 1972
297.354
+4.245
1.45%
jan 1, 1973
297.293
-0.061
-0.02%
jan 1, 1974
309.146
+11.853
3.99%
jan 1, 1975
316.352
+7.206
2.33%
jan 1, 1976
323.0
+6.648
2.1%
jan 1, 1977
327.112
+4.111
1.27%
jan 1, 1978
333.716
+6.604
2.02%
jan 1, 1979
343.905
+10.189
3.05%
jan 1, 1980
345.021
+1.115
0.32%
jan 1, 1981
363.349
+18.328
5.31%
jan 1, 1982
369.845
+6.496
1.79%
jan 1, 1983
374.972
+5.127
1.39%
jan 1, 1984
381.732
+6.76
1.8%
jan 1, 1985
387.45
+5.718
1.5%
jan 1, 1986
399.682
+12.232
3.16%
jan 1, 1987
403.649
+3.967
0.99%
jan 1, 1988
406.088
+2.439
0.6%
jan 1, 1989
399.891
-6.197
-1.53%
jan 1, 1990
407.06
+7.169
1.79%
jan 1, 1991
407.453
+0.393
0.1%
jan 1, 1992
399.989
-7.464
-1.83%
jan 1, 1993
417.284
+17.295
4.32%
jan 1, 1994
420.954
+3.67
0.88%
jan 1, 1995
441.985
+21.031
5.0%
jan 1, 1996
454.91
+12.925
2.92%
jan 1, 1997
457.558
+2.648
0.58%
jan 1, 1998
638.38
+180.822
39.52%
jan 1, 1999
654.298
+15.918
2.49%
jan 1, 2000
698.635
+44.338
6.78%
jan 1, 2001
708.552
+9.917
1.42%
jan 1, 2002
728.528
+19.976
2.82%
jan 1, 2003
725.624
-2.904
-0.4%
jan 1, 2004
782.601
+56.977
7.85%
jan 1, 2005
786.792
+4.191
0.54%
jan 1, 2006
795.807
+9.014
1.15%
jan 1, 2007
799.841
+4.034
0.51%
jan 1, 2008
807.581
+7.74
0.97%
jan 1, 2009
813.901
+6.32
0.78%
Ranking of countries by current statistics by years


Comments: