29
/
en
AIzaSyAYiBZKx7MnpbEhh9jyipgxe19OcubqV5w
April 1, 2024
199572
Mongolia
MNG
true
2
1
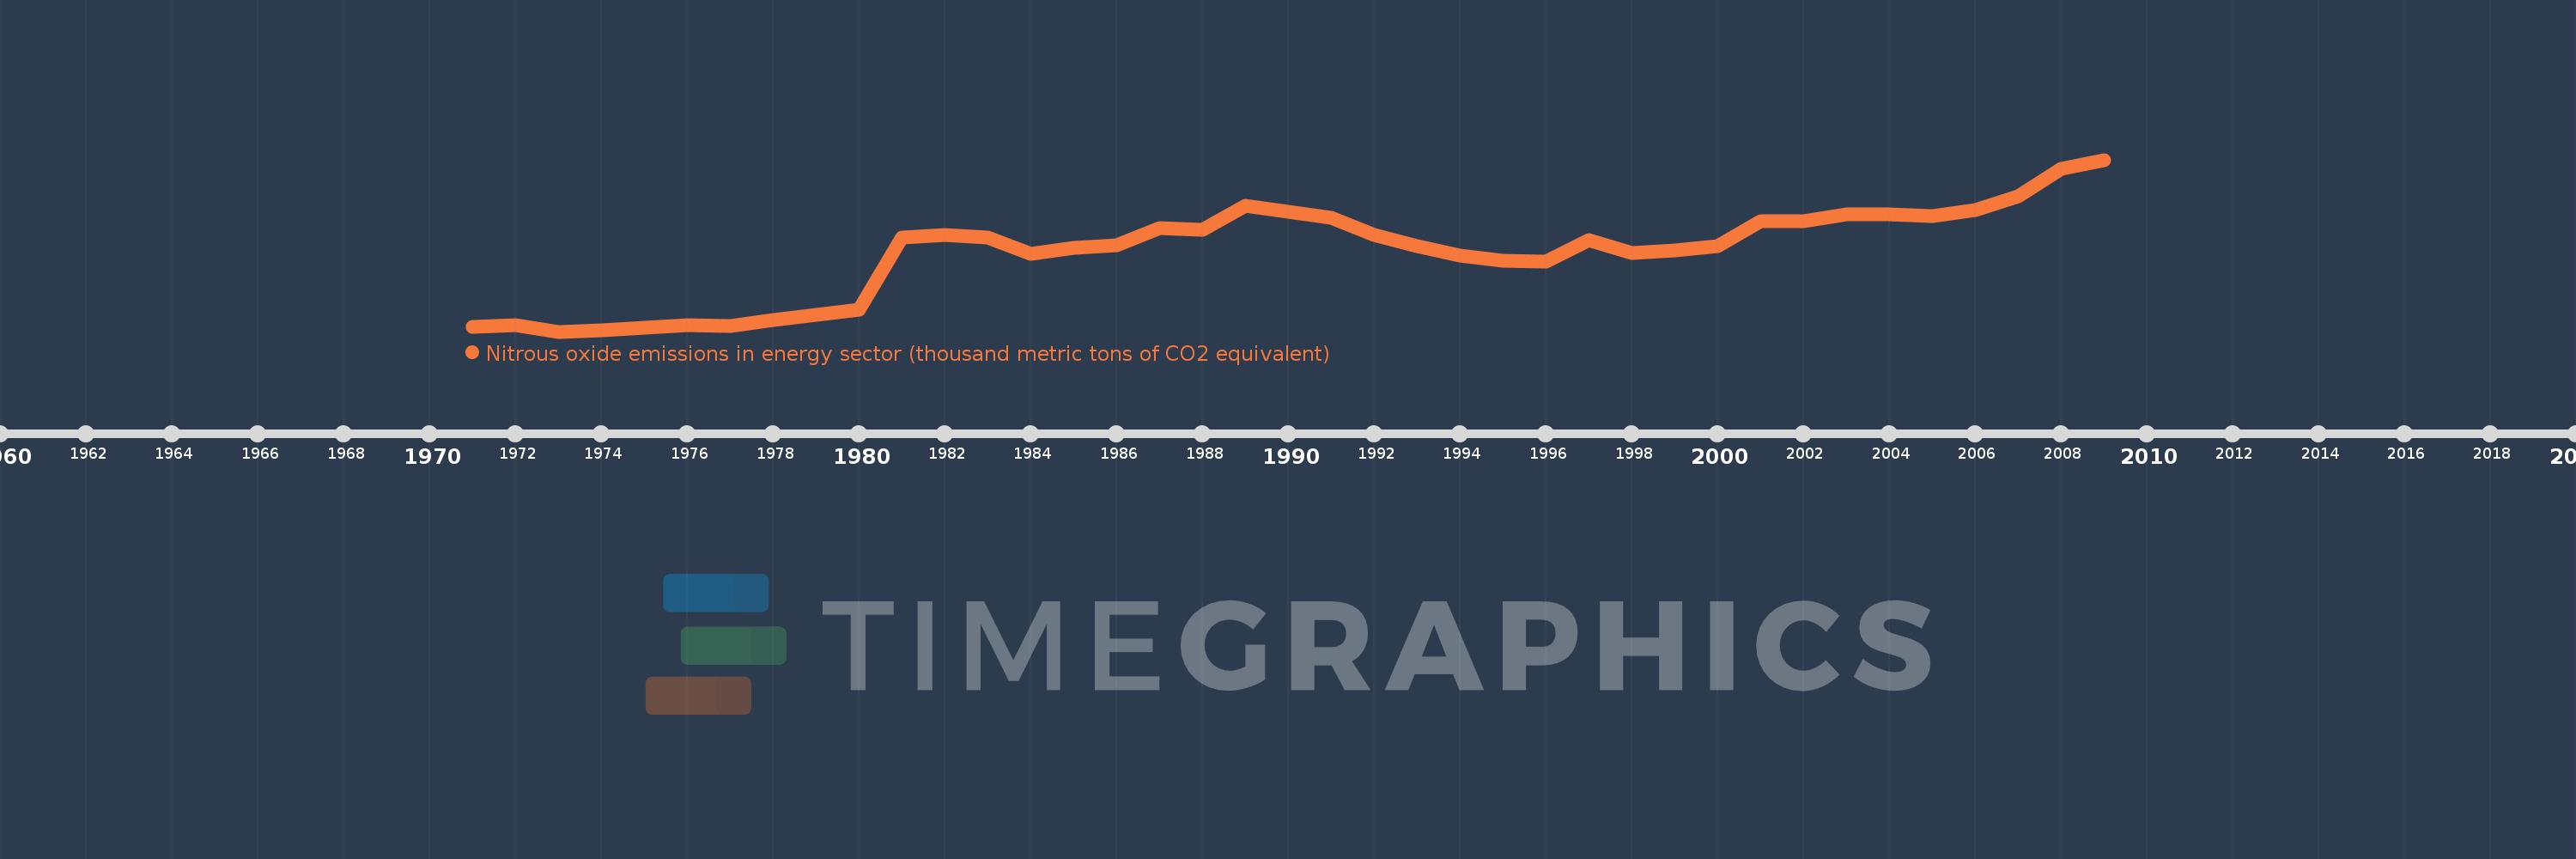
Nitrous oxide emissions in energy sector (thousand metric tons of CO2 equivalent)
2009,2008,2007,2006,2005,2004,2003,2002,2001,2000,1999,1998,1997,1996,1995,1994,1993,1992,1991,1990,1989,1988,1987,1986,1985,1984,1983,1982,1981,1980,1979,1978,1977,1976,1975,1974,1973,1972,1971
This statistics in other country:
AfghanistanAlbaniaAlgeriaAmerican SamoaAndorraAngolaAntigua and BarbudaArab WorldArgentinaArmeniaArubaAustraliaAustriaAzerbaijanBahamas, TheBahrainBangladeshBarbadosBelarusBelgiumBelizeBeninBermudaBhutanBoliviaBosnia and HerzegovinaBotswanaBrazilBritish Virgin IslandsBrunei DarussalamBulgariaBurkina FasoBurundiCabo VerdeCambodiaCameroonCanadaCaribbean small statesCayman IslandsCentral African RepublicCentral Europe and the BalticsChadChannel IslandsChileChinaColombiaComorosCongo, Dem. Rep.Congo, Rep.Costa RicaCote d'IvoireCroatiaCubaCuracaoCyprusCzech RepublicDenmarkDjiboutiDominicaDominican RepublicEarly-demographic dividendEast Asia & PacificEast Asia & Pacific (excluding high income)East Asia & Pacific (IDA & IBRD countries)EcuadorEgypt, Arab Rep.El SalvadorEquatorial GuineaEritreaEstoniaEthiopiaEuro areaEurope & Central AsiaEurope & Central Asia (excluding high income)Europe & Central Asia (IDA & IBRD countries)European UnionFaroe IslandsFijiFinlandFragile and conflict affected situationsFranceFrench PolynesiaGabonGambia, TheGeorgiaGermanyGhanaGibraltarGreeceGreenlandGrenadaGuamGuatemalaGuineaGuinea-BissauGuyanaHaitiHeavily indebted poor countries (HIPC)High incomeHondurasHong Kong SAR, ChinaHungaryIBRD onlyIcelandIDA & IBRD totalIDA blendIDA onlyIDA totalIndiaIndonesiaIran, Islamic Rep.IraqIrelandIsle of ManIsraelItalyJamaicaJapanJordanKazakhstanKenyaKiribatiKorea, Dem. People’s Rep.Korea, Rep.KosovoKuwaitKyrgyz RepublicLao PDRLate-demographic dividendLatin America & Caribbean Latin America & Caribbean (excluding high income)Latin America & the Caribbean (IDA & IBRD countries)LatviaLeast developed countries: UN classificationLebanonLesothoLiberiaLibyaLiechtensteinLithuaniaLow & middle incomeLow incomeLower middle incomeLuxembourgMacao SAR, ChinaMacedonia, FYRMadagascarMalawiMalaysiaMaldivesMaliMaltaMarshall IslandsMauritaniaMauritiusMexicoMicronesia, Fed. Sts.Middle East & North AfricaMiddle East & North Africa (excluding high income)Middle East & North Africa (IDA & IBRD countries)Middle incomeMoldovaMonacoMongoliaMontenegroMoroccoMozambiqueMyanmarNamibiaNauruNepalNetherlandsNew CaledoniaNew ZealandNicaraguaNigerNigeriaNorth AmericaNorthern Mariana IslandsNorwayOECD membersOmanOther small statesPacific island small statesPakistanPalauPanamaPapua New GuineaParaguayPeruPhilippinesPolandPortugalPost-demographic dividendPre-demographic dividendPuerto RicoQatarRomaniaRussian FederationRwandaSamoaSan MarinoSao Tome and PrincipeSaudi ArabiaSenegalSerbiaSeychellesSierra LeoneSingaporeSint Maarten (Dutch part)Slovak RepublicSloveniaSmall statesSolomon IslandsSomaliaSouth AfricaSouth AsiaSouth Asia (IDA & IBRD)South SudanSpainSri LankaSt. Kitts and NevisSt. LuciaSt. Martin (French part)St. Vincent and the GrenadinesSub-Saharan Africa Sub-Saharan Africa (excluding high income)Sub-Saharan Africa (IDA & IBRD countries)SudanSurinameSwazilandSwedenSwitzerlandSyrian Arab RepublicTajikistanTanzaniaThailandTimor-LesteTogoTongaTrinidad and TobagoTunisiaTurkeyTurkmenistanTurks and Caicos IslandsTuvaluUgandaUkraineUnited Arab EmiratesUnited KingdomUnited StatesUpper middle incomeUruguayUzbekistanVanuatuVenezuela, RBVietnamVirgin Islands (U.S.)West Bank and GazaWorldYemen, Rep.ZambiaZimbabwe Timeline:
This timeline shows a graph from 1971 to 2009 of Mongolia. No data until 1970. Number of actual observations by date: 39.
Source name:
World Development Indicators
Source organization:
European Commission, Joint Research Centre (JRC)/Netherlands Environmental Assessment Agency (PBL). Emission Database for Global Atmospheric Research (EDGAR): http://edgar.jrc.ec.europa.eu/
Categories, topics:
Energy & Mining, Environment
Last updated:
apr 23, 2017
Indicators value changes by year
Minimum:
34.954
jan 1, 1973
Maximum:
120.546
jan 1, 2009
At the date of observation
Value
Absolute change
Change from previous value
jan 1, 1971
37.116
+37.116
0.0%
jan 1, 1972
38.148
+1.032
2.78%
jan 1, 1973
34.954
-3.194
-8.37%
jan 1, 1974
35.733
+0.779
2.23%
jan 1, 1975
36.676
+0.943
2.64%
jan 1, 1976
38.359
+1.683
4.59%
jan 1, 1977
37.913
-0.446
-1.16%
jan 1, 1978
40.581
+2.668
7.04%
jan 1, 1979
43.2
+2.619
6.45%
jan 1, 1980
45.661
+2.462
5.7%
jan 1, 1981
81.781
+36.119
79.1%
jan 1, 1982
83.202
+1.421
1.74%
jan 1, 1983
81.662
-1.54
-1.85%
jan 1, 1984
73.678
-7.984
-9.78%
jan 1, 1985
76.864
+3.186
4.32%
jan 1, 1986
78.09
+1.226
1.6%
jan 1, 1987
86.593
+8.503
10.89%
jan 1, 1988
85.848
-0.745
-0.86%
jan 1, 1989
97.853
+12.005
13.98%
jan 1, 1990
94.592
-3.261
-3.33%
jan 1, 1991
91.478
-3.115
-3.29%
jan 1, 1992
82.972
-8.505
-9.3%
jan 1, 1993
77.403
-5.569
-6.71%
jan 1, 1994
72.781
-4.622
-5.97%
jan 1, 1995
70.417
-2.364
-3.25%
jan 1, 1996
69.978
-0.439
-0.62%
jan 1, 1997
80.372
+10.394
14.85%
jan 1, 1998
74.166
-6.206
-7.72%
jan 1, 1999
75.274
+1.108
1.49%
jan 1, 2000
77.601
+2.327
3.09%
jan 1, 2001
89.845
+12.244
15.78%
jan 1, 2002
90.137
+0.292
0.33%
jan 1, 2003
93.259
+3.122
3.46%
jan 1, 2004
93.525
+0.266
0.28%
jan 1, 2005
92.582
-0.943
-1.01%
jan 1, 2006
95.443
+2.861
3.09%
jan 1, 2007
102.545
+7.102
7.44%
jan 1, 2008
116.023
+13.479
13.14%
jan 1, 2009
120.546
+4.522
3.9%
Ranking of countries by current statistics by years


Comments: