29
/
en
AIzaSyAYiBZKx7MnpbEhh9jyipgxe19OcubqV5w
April 1, 2024
281405
Venezuela, RB
VEN
true
2
1
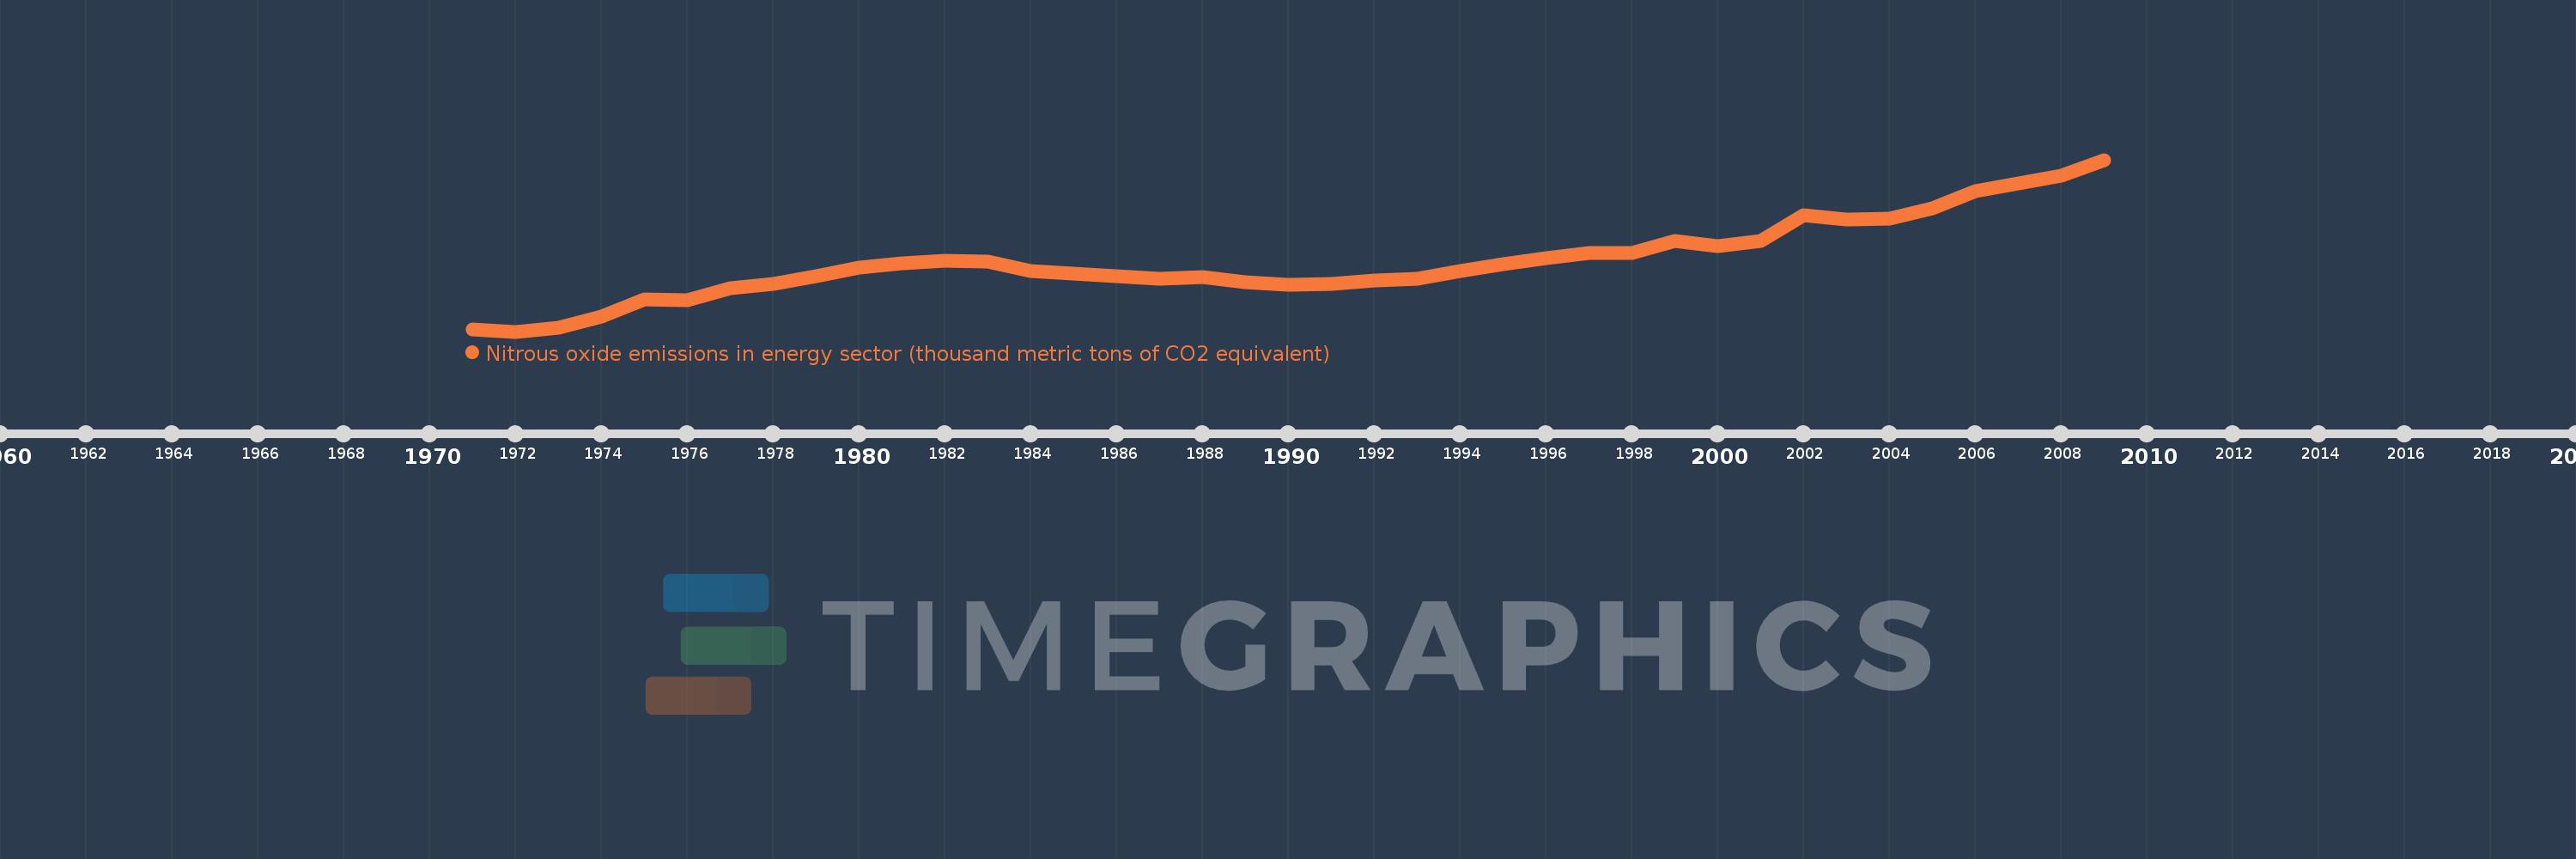
Nitrous oxide emissions in energy sector (thousand metric tons of CO2 equivalent)
2009,2008,2007,2006,2005,2004,2003,2002,2001,2000,1999,1998,1997,1996,1995,1994,1993,1992,1991,1990,1989,1988,1987,1986,1985,1984,1983,1982,1981,1980,1979,1978,1977,1976,1975,1974,1973,1972,1971
This statistics in other country:
AfghanistanAlbaniaAlgeriaAmerican SamoaAndorraAngolaAntigua and BarbudaArab WorldArgentinaArmeniaArubaAustraliaAustriaAzerbaijanBahamas, TheBahrainBangladeshBarbadosBelarusBelgiumBelizeBeninBermudaBhutanBoliviaBosnia and HerzegovinaBotswanaBrazilBritish Virgin IslandsBrunei DarussalamBulgariaBurkina FasoBurundiCabo VerdeCambodiaCameroonCanadaCaribbean small statesCayman IslandsCentral African RepublicCentral Europe and the BalticsChadChannel IslandsChileChinaColombiaComorosCongo, Dem. Rep.Congo, Rep.Costa RicaCote d'IvoireCroatiaCubaCuracaoCyprusCzech RepublicDenmarkDjiboutiDominicaDominican RepublicEarly-demographic dividendEast Asia & PacificEast Asia & Pacific (excluding high income)East Asia & Pacific (IDA & IBRD countries)EcuadorEgypt, Arab Rep.El SalvadorEquatorial GuineaEritreaEstoniaEthiopiaEuro areaEurope & Central AsiaEurope & Central Asia (excluding high income)Europe & Central Asia (IDA & IBRD countries)European UnionFaroe IslandsFijiFinlandFragile and conflict affected situationsFranceFrench PolynesiaGabonGambia, TheGeorgiaGermanyGhanaGibraltarGreeceGreenlandGrenadaGuamGuatemalaGuineaGuinea-BissauGuyanaHaitiHeavily indebted poor countries (HIPC)High incomeHondurasHong Kong SAR, ChinaHungaryIBRD onlyIcelandIDA & IBRD totalIDA blendIDA onlyIDA totalIndiaIndonesiaIran, Islamic Rep.IraqIrelandIsle of ManIsraelItalyJamaicaJapanJordanKazakhstanKenyaKiribatiKorea, Dem. People’s Rep.Korea, Rep.KosovoKuwaitKyrgyz RepublicLao PDRLate-demographic dividendLatin America & Caribbean Latin America & Caribbean (excluding high income)Latin America & the Caribbean (IDA & IBRD countries)LatviaLeast developed countries: UN classificationLebanonLesothoLiberiaLibyaLiechtensteinLithuaniaLow & middle incomeLow incomeLower middle incomeLuxembourgMacao SAR, ChinaMacedonia, FYRMadagascarMalawiMalaysiaMaldivesMaliMaltaMarshall IslandsMauritaniaMauritiusMexicoMicronesia, Fed. Sts.Middle East & North AfricaMiddle East & North Africa (excluding high income)Middle East & North Africa (IDA & IBRD countries)Middle incomeMoldovaMonacoMongoliaMontenegroMoroccoMozambiqueMyanmarNamibiaNauruNepalNetherlandsNew CaledoniaNew ZealandNicaraguaNigerNigeriaNorth AmericaNorthern Mariana IslandsNorwayOECD membersOmanOther small statesPacific island small statesPakistanPalauPanamaPapua New GuineaParaguayPeruPhilippinesPolandPortugalPost-demographic dividendPre-demographic dividendPuerto RicoQatarRomaniaRussian FederationRwandaSamoaSan MarinoSao Tome and PrincipeSaudi ArabiaSenegalSerbiaSeychellesSierra LeoneSingaporeSint Maarten (Dutch part)Slovak RepublicSloveniaSmall statesSolomon IslandsSomaliaSouth AfricaSouth AsiaSouth Asia (IDA & IBRD)South SudanSpainSri LankaSt. Kitts and NevisSt. LuciaSt. Martin (French part)St. Vincent and the GrenadinesSub-Saharan Africa Sub-Saharan Africa (excluding high income)Sub-Saharan Africa (IDA & IBRD countries)SudanSurinameSwazilandSwedenSwitzerlandSyrian Arab RepublicTajikistanTanzaniaThailandTimor-LesteTogoTongaTrinidad and TobagoTunisiaTurkeyTurkmenistanTurks and Caicos IslandsTuvaluUgandaUkraineUnited Arab EmiratesUnited KingdomUnited StatesUpper middle incomeUruguayUzbekistanVanuatuVenezuela, RBVietnamVirgin Islands (U.S.)West Bank and GazaWorldYemen, Rep.ZambiaZimbabwe Timeline:
This timeline shows a graph from 1971 to 2009 of Venezuela, RB. No data until 1970. Number of actual observations by date: 39.
Source name:
World Development Indicators
Source organization:
European Commission, Joint Research Centre (JRC)/Netherlands Environmental Assessment Agency (PBL). Emission Database for Global Atmospheric Research (EDGAR): http://edgar.jrc.ec.europa.eu/
Categories, topics:
Energy & Mining, Environment
Last updated:
apr 23, 2017
Indicators value changes by year
Minimum:
220.936
jan 1, 1972
Maximum:
736.587
jan 1, 2009
At the date of observation
Value
Absolute change
Change from previous value
jan 1, 1971
226.92
+226.92
0.0%
jan 1, 1972
220.936
-5.985
-2.64%
jan 1, 1973
232.693
+11.757
5.32%
jan 1, 1974
266.001
+33.308
14.31%
jan 1, 1975
317.071
+51.071
19.2%
jan 1, 1976
315.026
-2.046
-0.65%
jan 1, 1977
352.311
+37.285
11.84%
jan 1, 1978
363.796
+11.486
3.26%
jan 1, 1979
386.366
+22.57
6.2%
jan 1, 1980
412.528
+26.162
6.77%
jan 1, 1981
425.217
+12.689
3.08%
jan 1, 1982
433.819
+8.602
2.02%
jan 1, 1983
429.931
-3.889
-0.9%
jan 1, 1984
401.834
-28.096
-6.54%
jan 1, 1985
396.241
-5.593
-1.39%
jan 1, 1986
386.158
-10.082
-2.54%
jan 1, 1987
379.859
-6.299
-1.63%
jan 1, 1988
383.619
+3.76
0.99%
jan 1, 1989
368.067
-15.553
-4.05%
jan 1, 1990
362.04
-6.026
-1.64%
jan 1, 1991
364.645
+2.604
0.72%
jan 1, 1992
374.296
+9.652
2.65%
jan 1, 1993
379.129
+4.832
1.29%
jan 1, 1994
401.849
+22.721
5.99%
jan 1, 1995
424.314
+22.464
5.59%
jan 1, 1996
441.861
+17.548
4.14%
jan 1, 1997
456.379
+14.518
3.29%
jan 1, 1998
456.151
-0.229
-0.05%
jan 1, 1999
493.702
+37.551
8.23%
jan 1, 2000
478.434
-15.268
-3.09%
jan 1, 2001
493.146
+14.712
3.07%
jan 1, 2002
569.654
+76.508
15.51%
jan 1, 2003
557.736
-11.918
-2.09%
jan 1, 2004
559.524
+1.788
0.32%
jan 1, 2005
591.285
+31.761
5.68%
jan 1, 2006
642.91
+51.625
8.73%
jan 1, 2007
665.89
+22.981
3.57%
jan 1, 2008
687.99
+22.099
3.32%
jan 1, 2009
736.587
+48.598
7.06%
Ranking of countries by current statistics by years


Comments: