29
/
en
AIzaSyAYiBZKx7MnpbEhh9jyipgxe19OcubqV5w
April 1, 2024
26000
Central Europe and the Baltics
CEB
false
2
1
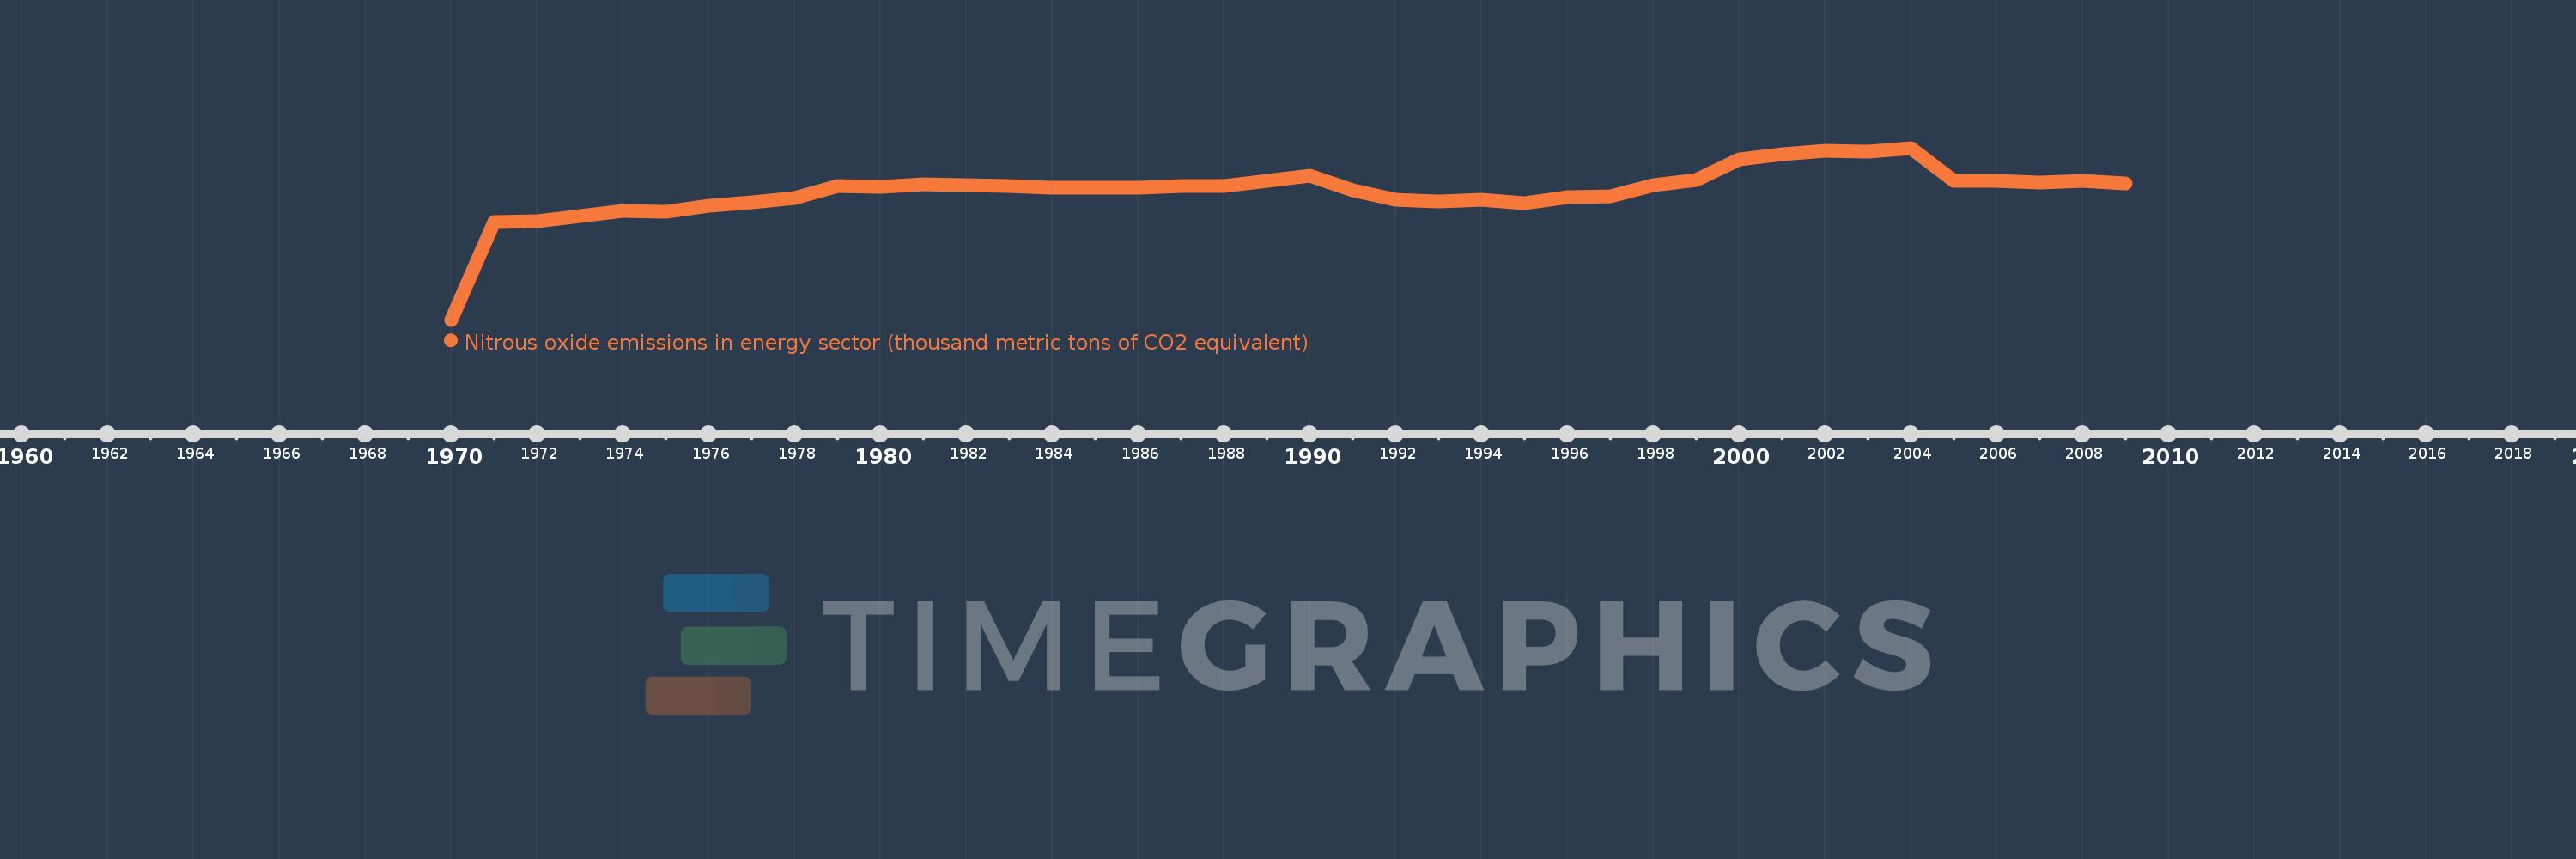
Nitrous oxide emissions in energy sector (thousand metric tons of CO2 equivalent)
2009,2008,2007,2006,2005,2004,2003,2002,2001,2000,1999,1998,1997,1996,1995,1994,1993,1992,1991,1990,1989,1988,1987,1986,1985,1984,1983,1982,1981,1980,1979,1978,1977,1976,1975,1974,1973,1972,1971,1970
This statistics in other country:
AfghanistanAlbaniaAlgeriaAmerican SamoaAndorraAngolaAntigua and BarbudaArab WorldArgentinaArmeniaArubaAustraliaAustriaAzerbaijanBahamas, TheBahrainBangladeshBarbadosBelarusBelgiumBelizeBeninBermudaBhutanBoliviaBosnia and HerzegovinaBotswanaBrazilBritish Virgin IslandsBrunei DarussalamBulgariaBurkina FasoBurundiCabo VerdeCambodiaCameroonCanadaCaribbean small statesCayman IslandsCentral African RepublicCentral Europe and the BalticsChadChannel IslandsChileChinaColombiaComorosCongo, Dem. Rep.Congo, Rep.Costa RicaCote d'IvoireCroatiaCubaCuracaoCyprusCzech RepublicDenmarkDjiboutiDominicaDominican RepublicEarly-demographic dividendEast Asia & PacificEast Asia & Pacific (excluding high income)East Asia & Pacific (IDA & IBRD countries)EcuadorEgypt, Arab Rep.El SalvadorEquatorial GuineaEritreaEstoniaEthiopiaEuro areaEurope & Central AsiaEurope & Central Asia (excluding high income)Europe & Central Asia (IDA & IBRD countries)European UnionFaroe IslandsFijiFinlandFragile and conflict affected situationsFranceFrench PolynesiaGabonGambia, TheGeorgiaGermanyGhanaGibraltarGreeceGreenlandGrenadaGuamGuatemalaGuineaGuinea-BissauGuyanaHaitiHeavily indebted poor countries (HIPC)High incomeHondurasHong Kong SAR, ChinaHungaryIBRD onlyIcelandIDA & IBRD totalIDA blendIDA onlyIDA totalIndiaIndonesiaIran, Islamic Rep.IraqIrelandIsle of ManIsraelItalyJamaicaJapanJordanKazakhstanKenyaKiribatiKorea, Dem. People’s Rep.Korea, Rep.KosovoKuwaitKyrgyz RepublicLao PDRLate-demographic dividendLatin America & Caribbean Latin America & Caribbean (excluding high income)Latin America & the Caribbean (IDA & IBRD countries)LatviaLeast developed countries: UN classificationLebanonLesothoLiberiaLibyaLiechtensteinLithuaniaLow & middle incomeLow incomeLower middle incomeLuxembourgMacao SAR, ChinaMacedonia, FYRMadagascarMalawiMalaysiaMaldivesMaliMaltaMarshall IslandsMauritaniaMauritiusMexicoMicronesia, Fed. Sts.Middle East & North AfricaMiddle East & North Africa (excluding high income)Middle East & North Africa (IDA & IBRD countries)Middle incomeMoldovaMonacoMongoliaMontenegroMoroccoMozambiqueMyanmarNamibiaNauruNepalNetherlandsNew CaledoniaNew ZealandNicaraguaNigerNigeriaNorth AmericaNorthern Mariana IslandsNorwayOECD membersOmanOther small statesPacific island small statesPakistanPalauPanamaPapua New GuineaParaguayPeruPhilippinesPolandPortugalPost-demographic dividendPre-demographic dividendPuerto RicoQatarRomaniaRussian FederationRwandaSamoaSan MarinoSao Tome and PrincipeSaudi ArabiaSenegalSerbiaSeychellesSierra LeoneSingaporeSint Maarten (Dutch part)Slovak RepublicSloveniaSmall statesSolomon IslandsSomaliaSouth AfricaSouth AsiaSouth Asia (IDA & IBRD)South SudanSpainSri LankaSt. Kitts and NevisSt. LuciaSt. Martin (French part)St. Vincent and the GrenadinesSub-Saharan Africa Sub-Saharan Africa (excluding high income)Sub-Saharan Africa (IDA & IBRD countries)SudanSurinameSwazilandSwedenSwitzerlandSyrian Arab RepublicTajikistanTanzaniaThailandTimor-LesteTogoTongaTrinidad and TobagoTunisiaTurkeyTurkmenistanTurks and Caicos IslandsTuvaluUgandaUkraineUnited Arab EmiratesUnited KingdomUnited StatesUpper middle incomeUruguayUzbekistanVanuatuVenezuela, RBVietnamVirgin Islands (U.S.)West Bank and GazaWorldYemen, Rep.ZambiaZimbabwe Timeline:
This timeline shows a graph from 1970 to 2009 of Central Europe and the Baltics. No data until 1969. Number of actual observations by date: 40.
Source name:
World Development Indicators
Source organization:
European Commission, Joint Research Centre (JRC)/Netherlands Environmental Assessment Agency (PBL). Emission Database for Global Atmospheric Research (EDGAR): http://edgar.jrc.ec.europa.eu/
Categories, topics:
Energy & Mining, Environment
Last updated:
apr 23, 2017
Indicators value changes by year
Maximum:
9.581K
jan 1, 2004
At the date of observation
Value
Absolute change
Change from previous value
jan 1, 1971
5.465K
+5.465K
%
jan 1, 1972
5.498K
+32.322
0.59%
jan 1, 1973
5.801K
+303.011
5.51%
jan 1, 1974
6.047K
+246.017
4.24%
jan 1, 1975
6.002K
-45.011
-0.74%
jan 1, 1976
6.336K
+334.24
5.57%
jan 1, 1977
6.544K
+208.321
3.29%
jan 1, 1978
6.793K
+248.953
3.8%
jan 1, 1979
7.479K
+686.063
10.1%
jan 1, 1980
7.42K
-59.473
-0.8%
jan 1, 1981
7.543K
+123.318
1.66%
jan 1, 1982
7.483K
-59.677
-0.79%
jan 1, 1983
7.449K
-34.006
-0.45%
jan 1, 1984
7.346K
-103.493
-1.39%
jan 1, 1985
7.376K
+30.222
0.41%
jan 1, 1986
7.375K
-1.028
-0.01%
jan 1, 1987
7.478K
+103.038
1.4%
jan 1, 1988
7.449K
-28.746
-0.38%
jan 1, 1989
7.763K
+313.151
4.2%
jan 1, 1990
8.018K
+255.156
3.29%
jan 1, 1991
7.219K
-798.944
-9.96%
jan 1, 1992
6.71K
-509.003
-7.05%
jan 1, 1993
6.606K
-104.02
-1.55%
jan 1, 1994
6.712K
+105.89
1.6%
jan 1, 1995
6.492K
-219.318
-3.27%
jan 1, 1996
6.828K
+335.833
5.17%
jan 1, 1997
6.904K
+75.977
1.11%
jan 1, 1998
7.507K
+603.391
8.74%
jan 1, 1999
7.787K
+279.311
3.72%
jan 1, 2000
8.923K
+1.136K
14.59%
jan 1, 2001
9.233K
+310.145
3.48%
jan 1, 2002
9.419K
+186.377
2.02%
jan 1, 2003
9.387K
-32.766
-0.35%
jan 1, 2004
9.581K
+194.274
2.07%
jan 1, 2005
7.77K
-1.811K
-18.9%
jan 1, 2006
7.731K
-38.827
-0.5%
jan 1, 2007
7.67K
-60.703
-0.79%
jan 1, 2008
7.755K
+84.442
1.1%
jan 1, 2009
7.608K
-146.596
-1.89%
Ranking of countries by current statistics by years


Comments: