29
/
en
AIzaSyAYiBZKx7MnpbEhh9jyipgxe19OcubqV5w
April 1, 2024
170318
Korea, Rep.
KOR
true
2
1
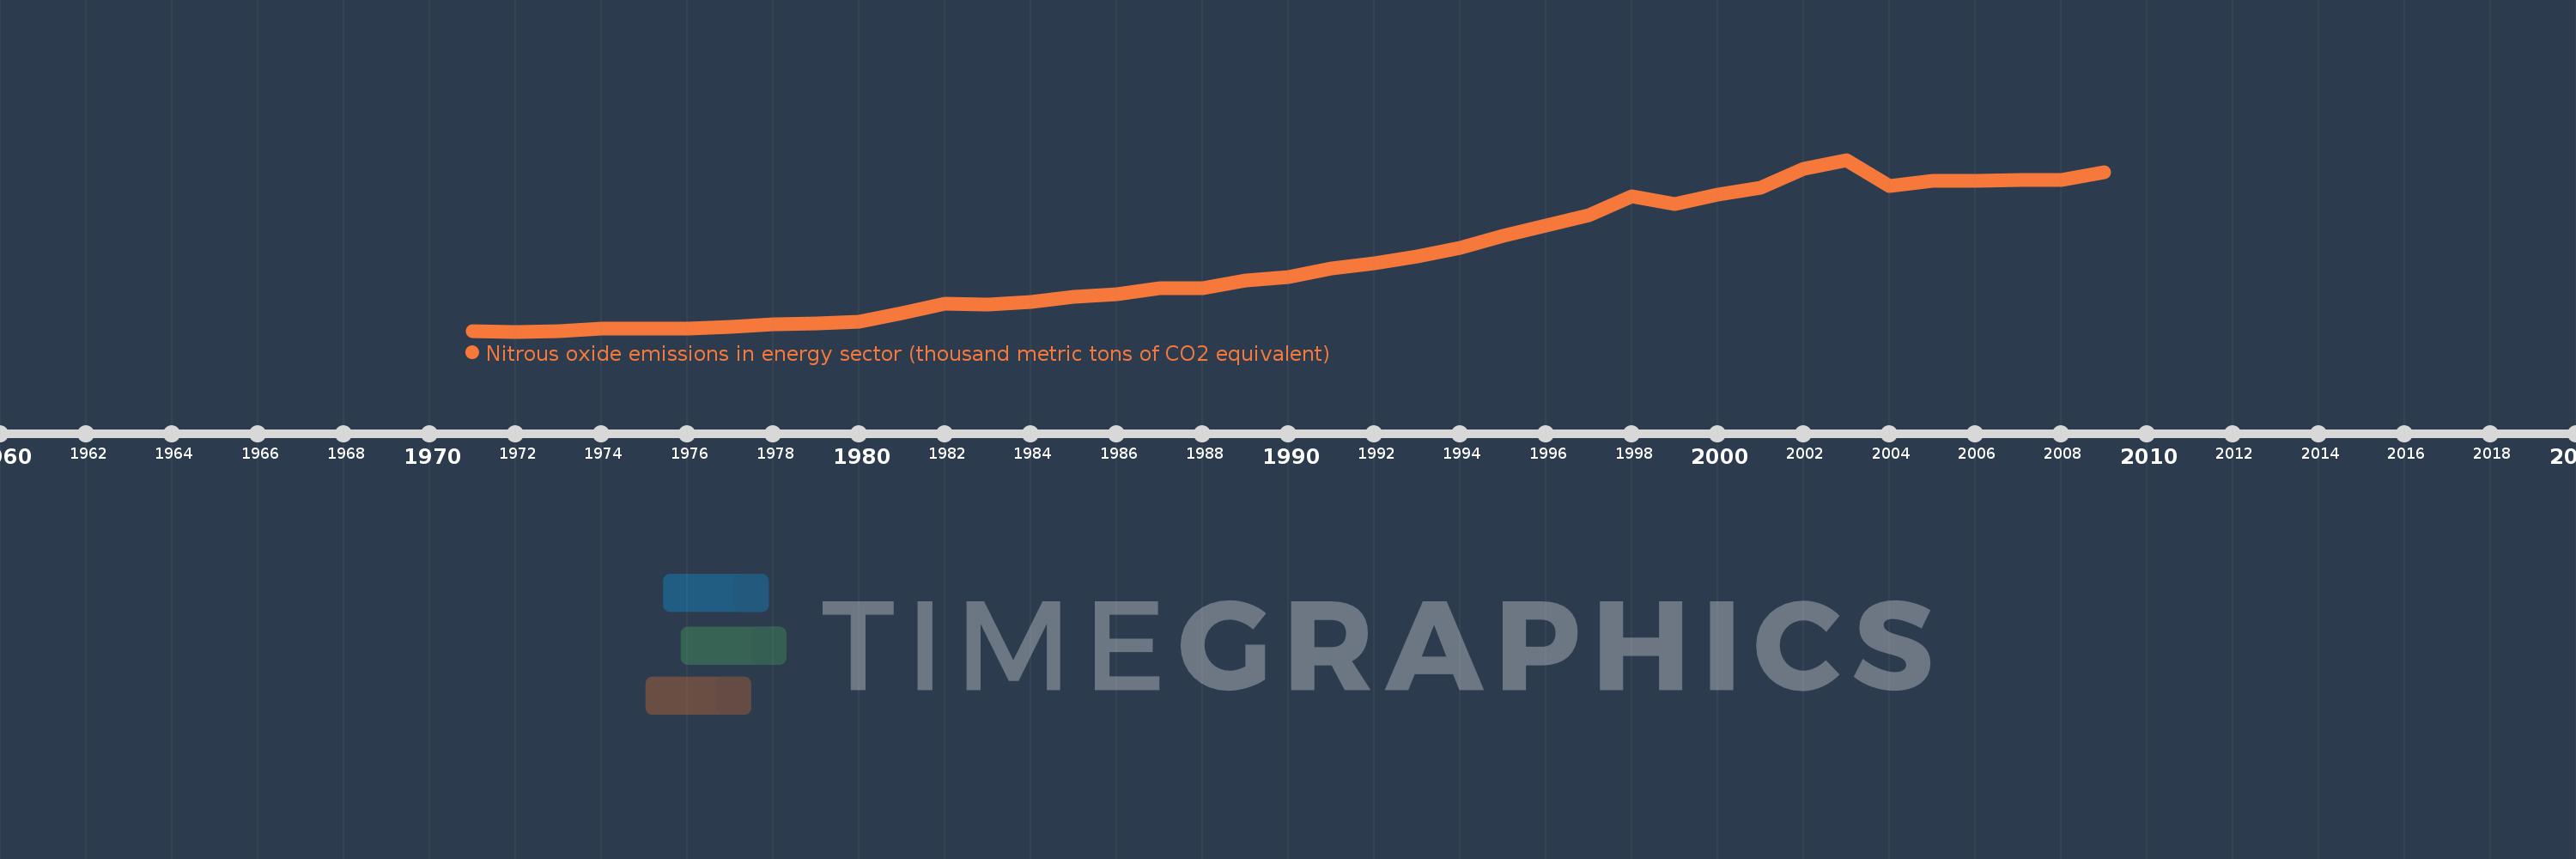
Nitrous oxide emissions in energy sector (thousand metric tons of CO2 equivalent)
2009,2008,2007,2006,2005,2004,2003,2002,2001,2000,1999,1998,1997,1996,1995,1994,1993,1992,1991,1990,1989,1988,1987,1986,1985,1984,1983,1982,1981,1980,1979,1978,1977,1976,1975,1974,1973,1972,1971
This statistics in other country:
AfghanistanAlbaniaAlgeriaAmerican SamoaAndorraAngolaAntigua and BarbudaArab WorldArgentinaArmeniaArubaAustraliaAustriaAzerbaijanBahamas, TheBahrainBangladeshBarbadosBelarusBelgiumBelizeBeninBermudaBhutanBoliviaBosnia and HerzegovinaBotswanaBrazilBritish Virgin IslandsBrunei DarussalamBulgariaBurkina FasoBurundiCabo VerdeCambodiaCameroonCanadaCaribbean small statesCayman IslandsCentral African RepublicCentral Europe and the BalticsChadChannel IslandsChileChinaColombiaComorosCongo, Dem. Rep.Congo, Rep.Costa RicaCote d'IvoireCroatiaCubaCuracaoCyprusCzech RepublicDenmarkDjiboutiDominicaDominican RepublicEarly-demographic dividendEast Asia & PacificEast Asia & Pacific (excluding high income)East Asia & Pacific (IDA & IBRD countries)EcuadorEgypt, Arab Rep.El SalvadorEquatorial GuineaEritreaEstoniaEthiopiaEuro areaEurope & Central AsiaEurope & Central Asia (excluding high income)Europe & Central Asia (IDA & IBRD countries)European UnionFaroe IslandsFijiFinlandFragile and conflict affected situationsFranceFrench PolynesiaGabonGambia, TheGeorgiaGermanyGhanaGibraltarGreeceGreenlandGrenadaGuamGuatemalaGuineaGuinea-BissauGuyanaHaitiHeavily indebted poor countries (HIPC)High incomeHondurasHong Kong SAR, ChinaHungaryIBRD onlyIcelandIDA & IBRD totalIDA blendIDA onlyIDA totalIndiaIndonesiaIran, Islamic Rep.IraqIrelandIsle of ManIsraelItalyJamaicaJapanJordanKazakhstanKenyaKiribatiKorea, Dem. People’s Rep.Korea, Rep.KosovoKuwaitKyrgyz RepublicLao PDRLate-demographic dividendLatin America & Caribbean Latin America & Caribbean (excluding high income)Latin America & the Caribbean (IDA & IBRD countries)LatviaLeast developed countries: UN classificationLebanonLesothoLiberiaLibyaLiechtensteinLithuaniaLow & middle incomeLow incomeLower middle incomeLuxembourgMacao SAR, ChinaMacedonia, FYRMadagascarMalawiMalaysiaMaldivesMaliMaltaMarshall IslandsMauritaniaMauritiusMexicoMicronesia, Fed. Sts.Middle East & North AfricaMiddle East & North Africa (excluding high income)Middle East & North Africa (IDA & IBRD countries)Middle incomeMoldovaMonacoMongoliaMontenegroMoroccoMozambiqueMyanmarNamibiaNauruNepalNetherlandsNew CaledoniaNew ZealandNicaraguaNigerNigeriaNorth AmericaNorthern Mariana IslandsNorwayOECD membersOmanOther small statesPacific island small statesPakistanPalauPanamaPapua New GuineaParaguayPeruPhilippinesPolandPortugalPost-demographic dividendPre-demographic dividendPuerto RicoQatarRomaniaRussian FederationRwandaSamoaSan MarinoSao Tome and PrincipeSaudi ArabiaSenegalSerbiaSeychellesSierra LeoneSingaporeSint Maarten (Dutch part)Slovak RepublicSloveniaSmall statesSolomon IslandsSomaliaSouth AfricaSouth AsiaSouth Asia (IDA & IBRD)South SudanSpainSri LankaSt. Kitts and NevisSt. LuciaSt. Martin (French part)St. Vincent and the GrenadinesSub-Saharan Africa Sub-Saharan Africa (excluding high income)Sub-Saharan Africa (IDA & IBRD countries)SudanSurinameSwazilandSwedenSwitzerlandSyrian Arab RepublicTajikistanTanzaniaThailandTimor-LesteTogoTongaTrinidad and TobagoTunisiaTurkeyTurkmenistanTurks and Caicos IslandsTuvaluUgandaUkraineUnited Arab EmiratesUnited KingdomUnited StatesUpper middle incomeUruguayUzbekistanVanuatuVenezuela, RBVietnamVirgin Islands (U.S.)West Bank and GazaWorldYemen, Rep.ZambiaZimbabwe Timeline:
This timeline shows a graph from 1971 to 2009 of Korea, Rep.. No data until 1970. Number of actual observations by date: 39.
Source name:
World Development Indicators
Source organization:
European Commission, Joint Research Centre (JRC)/Netherlands Environmental Assessment Agency (PBL). Emission Database for Global Atmospheric Research (EDGAR): http://edgar.jrc.ec.europa.eu/
Categories, topics:
Energy & Mining, Environment
Last updated:
apr 23, 2017
Indicators value changes by year
Minimum:
232.974
jan 1, 1972
Maximum:
3.519K
jan 1, 2003
At the date of observation
Value
Absolute change
Change from previous value
jan 1, 1971
233.259
+233.259
0.0%
jan 1, 1972
232.974
-0.284
-0.12%
jan 1, 1973
239.004
+6.03
2.59%
jan 1, 1974
284.069
+45.065
18.86%
jan 1, 1975
286.186
+2.117
0.75%
jan 1, 1976
296.423
+10.237
3.58%
jan 1, 1977
323.089
+26.667
9.0%
jan 1, 1978
365.305
+42.215
13.07%
jan 1, 1979
388.986
+23.681
6.48%
jan 1, 1980
428.772
+39.786
10.23%
jan 1, 1981
584.759
+155.987
36.38%
jan 1, 1982
762.58
+177.82
30.41%
jan 1, 1983
758.292
-4.287
-0.56%
jan 1, 1984
792.844
+34.552
4.56%
jan 1, 1985
896.717
+103.874
13.1%
jan 1, 1986
947.086
+50.368
5.62%
jan 1, 1987
1.058K
+111.216
11.74%
jan 1, 1988
1.058K
-0.292
-0.03%
jan 1, 1989
1.214K
+155.73
14.72%
jan 1, 1990
1.274K
+60.127
4.95%
jan 1, 1991
1.437K
+163.337
12.82%
jan 1, 1992
1.543K
+105.311
7.33%
jan 1, 1993
1.664K
+121.296
7.86%
jan 1, 1994
1.84K
+176.624
10.62%
jan 1, 1995
2.066K
+225.957
12.28%
jan 1, 1996
2.259K
+192.603
9.32%
jan 1, 1997
2.456K
+197.47
8.74%
jan 1, 1998
2.812K
+356.026
14.49%
jan 1, 1999
2.671K
-141.907
-5.05%
jan 1, 2000
2.855K
+184.324
6.9%
jan 1, 2001
2.984K
+128.851
4.51%
jan 1, 2002
3.346K
+362.1
12.14%
jan 1, 2003
3.519K
+173.009
5.17%
jan 1, 2004
3.025K
-493.578
-14.03%
jan 1, 2005
3.11K
+84.382
2.79%
jan 1, 2006
3.118K
+8.521
0.27%
jan 1, 2007
3.131K
+13.187
0.42%
jan 1, 2008
3.14K
+8.994
0.29%
jan 1, 2009
3.28K
+139.787
4.45%
Ranking of countries by current statistics by years


Comments: