29
/
en
AIzaSyAYiBZKx7MnpbEhh9jyipgxe19OcubqV5w
April 1, 2024
140820
Ghana
GHA
true
2
1
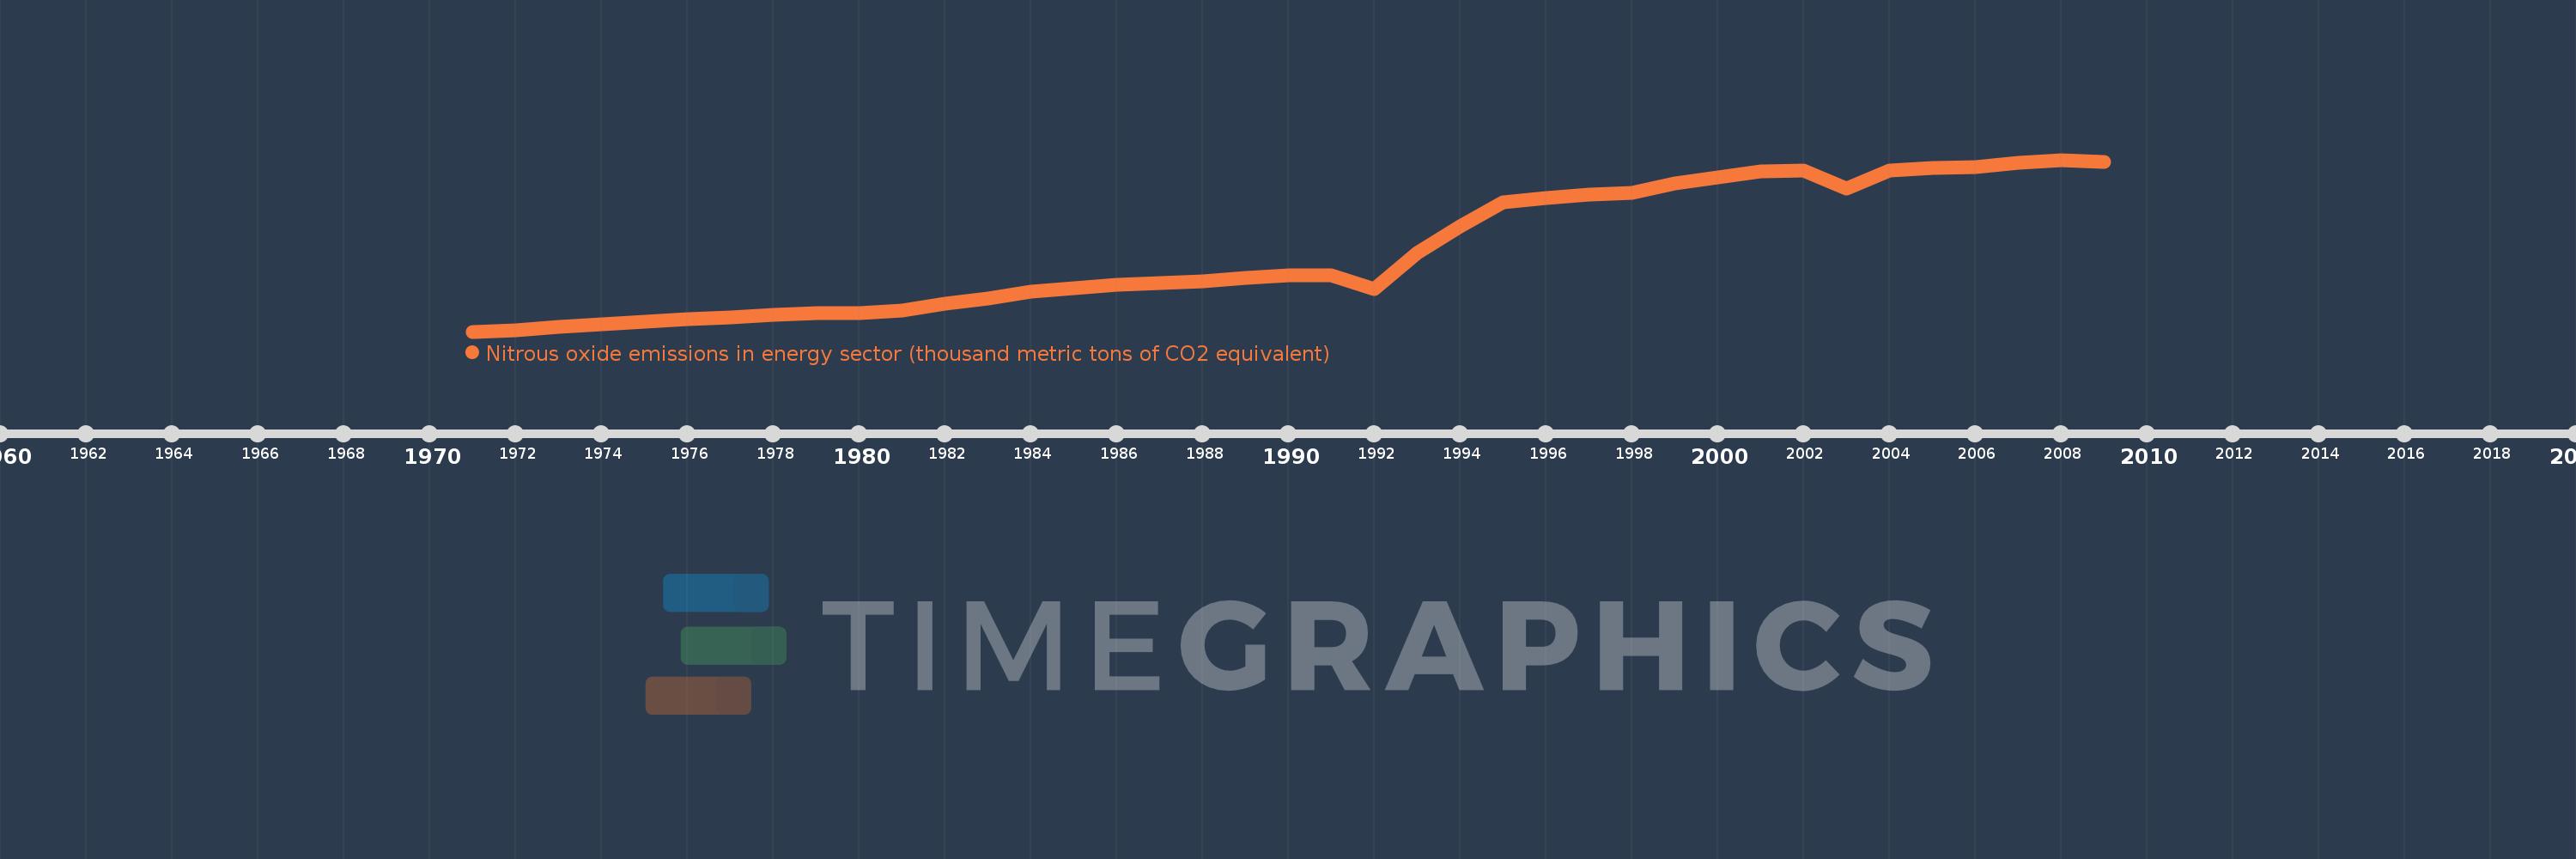
Nitrous oxide emissions in energy sector (thousand metric tons of CO2 equivalent)
2009,2008,2007,2006,2005,2004,2003,2002,2001,2000,1999,1998,1997,1996,1995,1994,1993,1992,1991,1990,1989,1988,1987,1986,1985,1984,1983,1982,1981,1980,1979,1978,1977,1976,1975,1974,1973,1972,1971
This statistics in other country:
AfghanistanAlbaniaAlgeriaAmerican SamoaAndorraAngolaAntigua and BarbudaArab WorldArgentinaArmeniaArubaAustraliaAustriaAzerbaijanBahamas, TheBahrainBangladeshBarbadosBelarusBelgiumBelizeBeninBermudaBhutanBoliviaBosnia and HerzegovinaBotswanaBrazilBritish Virgin IslandsBrunei DarussalamBulgariaBurkina FasoBurundiCabo VerdeCambodiaCameroonCanadaCaribbean small statesCayman IslandsCentral African RepublicCentral Europe and the BalticsChadChannel IslandsChileChinaColombiaComorosCongo, Dem. Rep.Congo, Rep.Costa RicaCote d'IvoireCroatiaCubaCuracaoCyprusCzech RepublicDenmarkDjiboutiDominicaDominican RepublicEarly-demographic dividendEast Asia & PacificEast Asia & Pacific (excluding high income)East Asia & Pacific (IDA & IBRD countries)EcuadorEgypt, Arab Rep.El SalvadorEquatorial GuineaEritreaEstoniaEthiopiaEuro areaEurope & Central AsiaEurope & Central Asia (excluding high income)Europe & Central Asia (IDA & IBRD countries)European UnionFaroe IslandsFijiFinlandFragile and conflict affected situationsFranceFrench PolynesiaGabonGambia, TheGeorgiaGermanyGhanaGibraltarGreeceGreenlandGrenadaGuamGuatemalaGuineaGuinea-BissauGuyanaHaitiHeavily indebted poor countries (HIPC)High incomeHondurasHong Kong SAR, ChinaHungaryIBRD onlyIcelandIDA & IBRD totalIDA blendIDA onlyIDA totalIndiaIndonesiaIran, Islamic Rep.IraqIrelandIsle of ManIsraelItalyJamaicaJapanJordanKazakhstanKenyaKiribatiKorea, Dem. People’s Rep.Korea, Rep.KosovoKuwaitKyrgyz RepublicLao PDRLate-demographic dividendLatin America & Caribbean Latin America & Caribbean (excluding high income)Latin America & the Caribbean (IDA & IBRD countries)LatviaLeast developed countries: UN classificationLebanonLesothoLiberiaLibyaLiechtensteinLithuaniaLow & middle incomeLow incomeLower middle incomeLuxembourgMacao SAR, ChinaMacedonia, FYRMadagascarMalawiMalaysiaMaldivesMaliMaltaMarshall IslandsMauritaniaMauritiusMexicoMicronesia, Fed. Sts.Middle East & North AfricaMiddle East & North Africa (excluding high income)Middle East & North Africa (IDA & IBRD countries)Middle incomeMoldovaMonacoMongoliaMontenegroMoroccoMozambiqueMyanmarNamibiaNauruNepalNetherlandsNew CaledoniaNew ZealandNicaraguaNigerNigeriaNorth AmericaNorthern Mariana IslandsNorwayOECD membersOmanOther small statesPacific island small statesPakistanPalauPanamaPapua New GuineaParaguayPeruPhilippinesPolandPortugalPost-demographic dividendPre-demographic dividendPuerto RicoQatarRomaniaRussian FederationRwandaSamoaSan MarinoSao Tome and PrincipeSaudi ArabiaSenegalSerbiaSeychellesSierra LeoneSingaporeSint Maarten (Dutch part)Slovak RepublicSloveniaSmall statesSolomon IslandsSomaliaSouth AfricaSouth AsiaSouth Asia (IDA & IBRD)South SudanSpainSri LankaSt. Kitts and NevisSt. LuciaSt. Martin (French part)St. Vincent and the GrenadinesSub-Saharan Africa Sub-Saharan Africa (excluding high income)Sub-Saharan Africa (IDA & IBRD countries)SudanSurinameSwazilandSwedenSwitzerlandSyrian Arab RepublicTajikistanTanzaniaThailandTimor-LesteTogoTongaTrinidad and TobagoTunisiaTurkeyTurkmenistanTurks and Caicos IslandsTuvaluUgandaUkraineUnited Arab EmiratesUnited KingdomUnited StatesUpper middle incomeUruguayUzbekistanVanuatuVenezuela, RBVietnamVirgin Islands (U.S.)West Bank and GazaWorldYemen, Rep.ZambiaZimbabwe Timeline:
This timeline shows a graph from 1971 to 2009 of Ghana. No data until 1970. Number of actual observations by date: 39.
Source name:
World Development Indicators
Source organization:
European Commission, Joint Research Centre (JRC)/Netherlands Environmental Assessment Agency (PBL). Emission Database for Global Atmospheric Research (EDGAR): http://edgar.jrc.ec.europa.eu/
Categories, topics:
Energy & Mining, Environment
Last updated:
apr 23, 2017
Indicators value changes by year
Minimum:
155.939
jan 1, 1971
Maximum:
463.271
jan 1, 2008
At the date of observation
Value
Absolute change
Change from previous value
jan 1, 1971
155.939
+155.939
0.0%
jan 1, 1972
158.825
+2.886
1.85%
jan 1, 1973
164.107
+5.282
3.33%
jan 1, 1974
168.932
+4.825
2.94%
jan 1, 1975
173.486
+4.554
2.7%
jan 1, 1976
177.631
+4.144
2.39%
jan 1, 1977
181.582
+3.952
2.22%
jan 1, 1978
186.212
+4.63
2.55%
jan 1, 1979
188.608
+2.396
1.29%
jan 1, 1980
188.455
-0.153
-0.08%
jan 1, 1981
193.052
+4.597
2.44%
jan 1, 1982
205.308
+12.256
6.35%
jan 1, 1983
215.554
+10.246
4.99%
jan 1, 1984
227.252
+11.698
5.43%
jan 1, 1985
233.457
+6.205
2.73%
jan 1, 1986
239.663
+6.206
2.66%
jan 1, 1987
243.094
+3.431
1.43%
jan 1, 1988
246.276
+3.182
1.31%
jan 1, 1989
251.98
+5.703
2.32%
jan 1, 1990
257.269
+5.289
2.1%
jan 1, 1991
256.004
-1.265
-0.49%
jan 1, 1992
231.972
-24.032
-9.39%
jan 1, 1993
296.939
+64.968
28.01%
jan 1, 1994
344.575
+47.636
16.04%
jan 1, 1995
387.761
+43.186
12.53%
jan 1, 1996
394.322
+6.561
1.69%
jan 1, 1997
400.652
+6.329
1.61%
jan 1, 1998
404.186
+3.534
0.88%
jan 1, 1999
421.641
+17.455
4.32%
jan 1, 2000
431.58
+9.939
2.36%
jan 1, 2001
443.081
+11.501
2.66%
jan 1, 2002
444.04
+0.959
0.22%
jan 1, 2003
412.344
-31.696
-7.14%
jan 1, 2004
443.768
+31.424
7.62%
jan 1, 2005
448.867
+5.098
1.15%
jan 1, 2006
449.874
+1.008
0.22%
jan 1, 2007
458.199
+8.325
1.85%
jan 1, 2008
463.271
+5.071
1.11%
jan 1, 2009
458.756
-4.515
-0.97%
Ranking of countries by current statistics by years


Comments: