29
/
en
AIzaSyAYiBZKx7MnpbEhh9jyipgxe19OcubqV5w
April 1, 2024
167921
Kenya
KEN
true
2
1
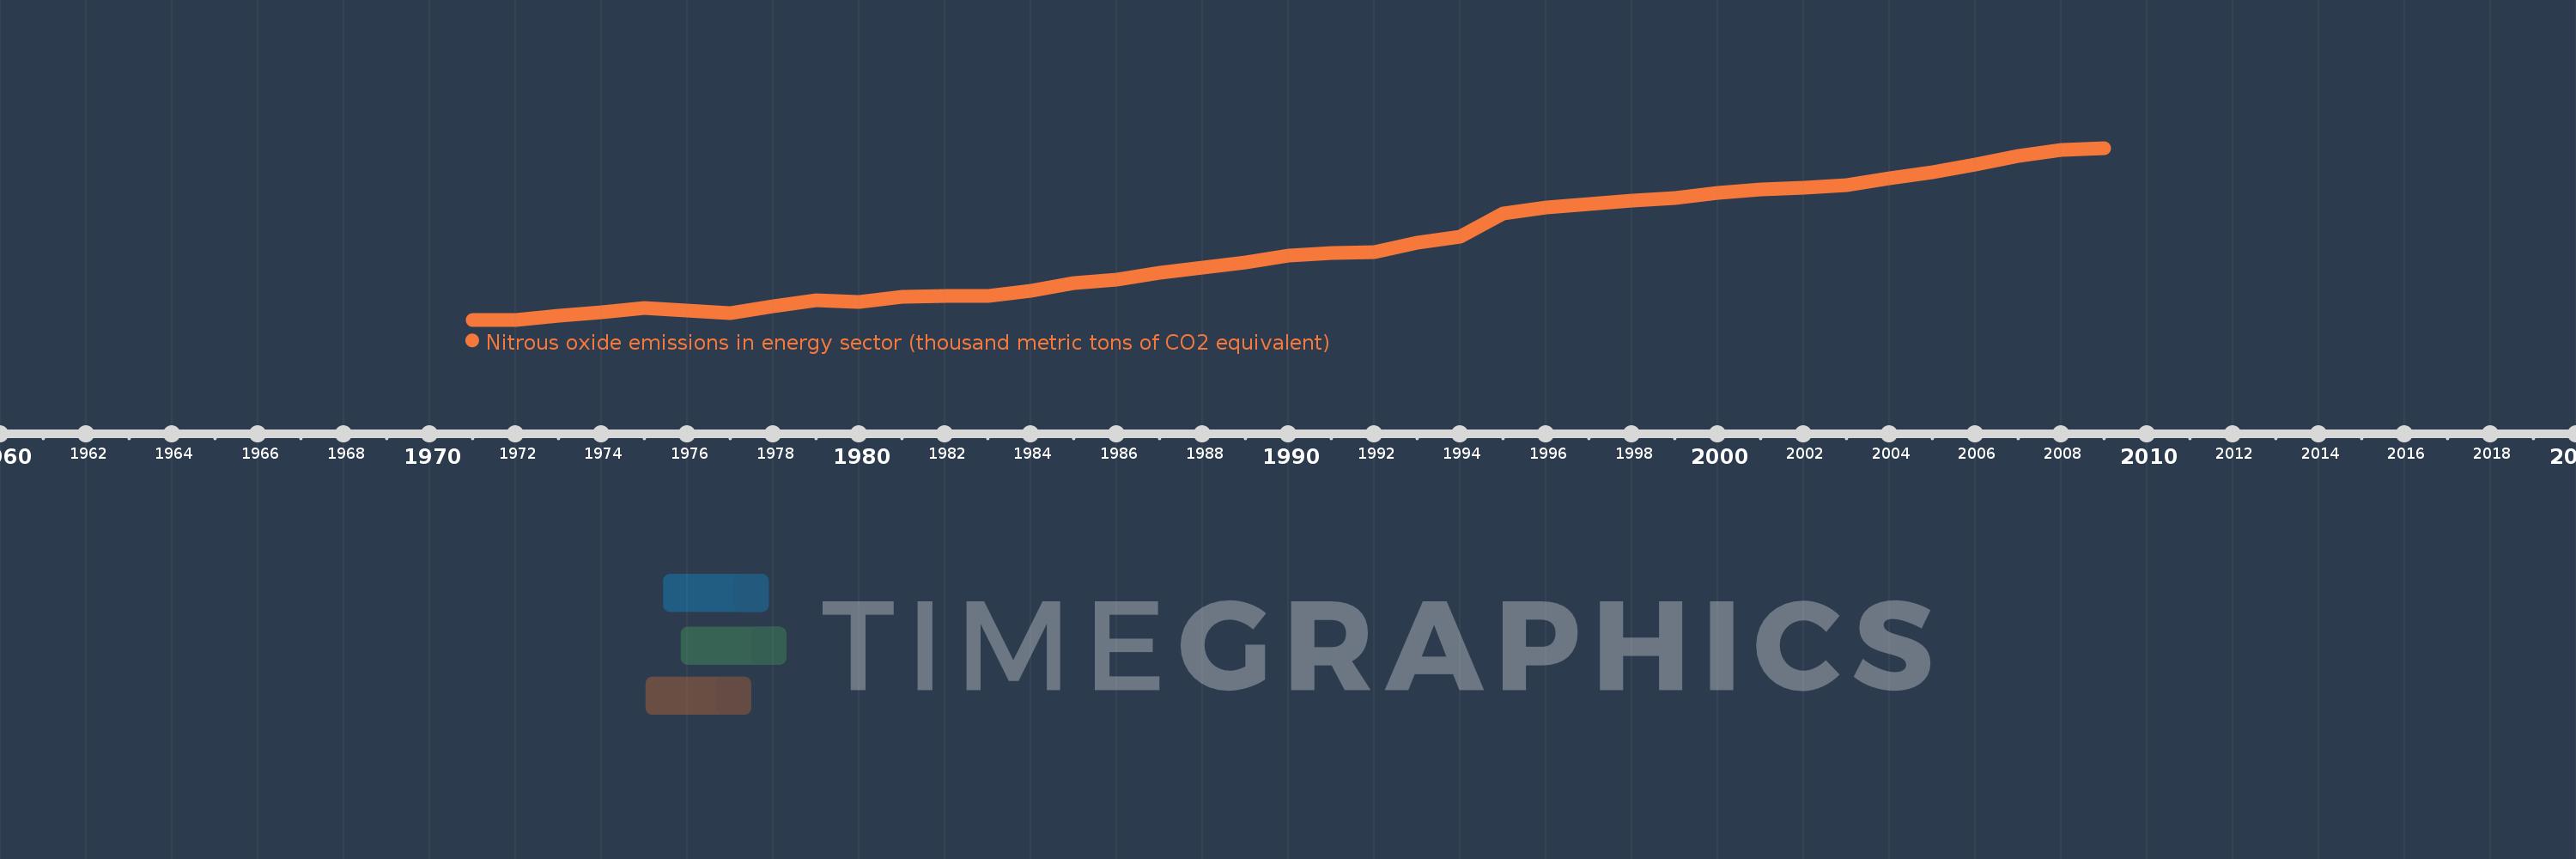
Nitrous oxide emissions in energy sector (thousand metric tons of CO2 equivalent)
2009,2008,2007,2006,2005,2004,2003,2002,2001,2000,1999,1998,1997,1996,1995,1994,1993,1992,1991,1990,1989,1988,1987,1986,1985,1984,1983,1982,1981,1980,1979,1978,1977,1976,1975,1974,1973,1972,1971
This statistics in other country:
AfghanistanAlbaniaAlgeriaAmerican SamoaAndorraAngolaAntigua and BarbudaArab WorldArgentinaArmeniaArubaAustraliaAustriaAzerbaijanBahamas, TheBahrainBangladeshBarbadosBelarusBelgiumBelizeBeninBermudaBhutanBoliviaBosnia and HerzegovinaBotswanaBrazilBritish Virgin IslandsBrunei DarussalamBulgariaBurkina FasoBurundiCabo VerdeCambodiaCameroonCanadaCaribbean small statesCayman IslandsCentral African RepublicCentral Europe and the BalticsChadChannel IslandsChileChinaColombiaComorosCongo, Dem. Rep.Congo, Rep.Costa RicaCote d'IvoireCroatiaCubaCuracaoCyprusCzech RepublicDenmarkDjiboutiDominicaDominican RepublicEarly-demographic dividendEast Asia & PacificEast Asia & Pacific (excluding high income)East Asia & Pacific (IDA & IBRD countries)EcuadorEgypt, Arab Rep.El SalvadorEquatorial GuineaEritreaEstoniaEthiopiaEuro areaEurope & Central AsiaEurope & Central Asia (excluding high income)Europe & Central Asia (IDA & IBRD countries)European UnionFaroe IslandsFijiFinlandFragile and conflict affected situationsFranceFrench PolynesiaGabonGambia, TheGeorgiaGermanyGhanaGibraltarGreeceGreenlandGrenadaGuamGuatemalaGuineaGuinea-BissauGuyanaHaitiHeavily indebted poor countries (HIPC)High incomeHondurasHong Kong SAR, ChinaHungaryIBRD onlyIcelandIDA & IBRD totalIDA blendIDA onlyIDA totalIndiaIndonesiaIran, Islamic Rep.IraqIrelandIsle of ManIsraelItalyJamaicaJapanJordanKazakhstanKenyaKiribatiKorea, Dem. People’s Rep.Korea, Rep.KosovoKuwaitKyrgyz RepublicLao PDRLate-demographic dividendLatin America & Caribbean Latin America & Caribbean (excluding high income)Latin America & the Caribbean (IDA & IBRD countries)LatviaLeast developed countries: UN classificationLebanonLesothoLiberiaLibyaLiechtensteinLithuaniaLow & middle incomeLow incomeLower middle incomeLuxembourgMacao SAR, ChinaMacedonia, FYRMadagascarMalawiMalaysiaMaldivesMaliMaltaMarshall IslandsMauritaniaMauritiusMexicoMicronesia, Fed. Sts.Middle East & North AfricaMiddle East & North Africa (excluding high income)Middle East & North Africa (IDA & IBRD countries)Middle incomeMoldovaMonacoMongoliaMontenegroMoroccoMozambiqueMyanmarNamibiaNauruNepalNetherlandsNew CaledoniaNew ZealandNicaraguaNigerNigeriaNorth AmericaNorthern Mariana IslandsNorwayOECD membersOmanOther small statesPacific island small statesPakistanPalauPanamaPapua New GuineaParaguayPeruPhilippinesPolandPortugalPost-demographic dividendPre-demographic dividendPuerto RicoQatarRomaniaRussian FederationRwandaSamoaSan MarinoSao Tome and PrincipeSaudi ArabiaSenegalSerbiaSeychellesSierra LeoneSingaporeSint Maarten (Dutch part)Slovak RepublicSloveniaSmall statesSolomon IslandsSomaliaSouth AfricaSouth AsiaSouth Asia (IDA & IBRD)South SudanSpainSri LankaSt. Kitts and NevisSt. LuciaSt. Martin (French part)St. Vincent and the GrenadinesSub-Saharan Africa Sub-Saharan Africa (excluding high income)Sub-Saharan Africa (IDA & IBRD countries)SudanSurinameSwazilandSwedenSwitzerlandSyrian Arab RepublicTajikistanTanzaniaThailandTimor-LesteTogoTongaTrinidad and TobagoTunisiaTurkeyTurkmenistanTurks and Caicos IslandsTuvaluUgandaUkraineUnited Arab EmiratesUnited KingdomUnited StatesUpper middle incomeUruguayUzbekistanVanuatuVenezuela, RBVietnamVirgin Islands (U.S.)West Bank and GazaWorldYemen, Rep.ZambiaZimbabwe Timeline:
This timeline shows a graph from 1971 to 2009 of Kenya. No data until 1970. Number of actual observations by date: 39.
Source name:
World Development Indicators
Source organization:
European Commission, Joint Research Centre (JRC)/Netherlands Environmental Assessment Agency (PBL). Emission Database for Global Atmospheric Research (EDGAR): http://edgar.jrc.ec.europa.eu/
Categories, topics:
Energy & Mining, Environment
Last updated:
apr 23, 2017
Indicators value changes by year
Minimum:
276.984
jan 1, 1971
Maximum:
637.728
jan 1, 2009
At the date of observation
Value
Absolute change
Change from previous value
jan 1, 1971
276.984
+276.984
0.0%
jan 1, 1972
277.271
+0.287
0.1%
jan 1, 1973
286.246
+8.975
3.24%
jan 1, 1974
292.367
+6.121
2.14%
jan 1, 1975
301.55
+9.182
3.14%
jan 1, 1976
296.038
-5.511
-1.83%
jan 1, 1977
291.662
-4.377
-1.48%
jan 1, 1978
305.183
+13.521
4.64%
jan 1, 1979
318.007
+12.825
4.2%
jan 1, 1980
313.899
-4.108
-1.29%
jan 1, 1981
325.524
+11.625
3.7%
jan 1, 1982
326.405
+0.881
0.27%
jan 1, 1983
327.434
+1.029
0.32%
jan 1, 1984
337.902
+10.469
3.2%
jan 1, 1985
353.214
+15.312
4.53%
jan 1, 1986
361.91
+8.696
2.46%
jan 1, 1987
375.436
+13.525
3.74%
jan 1, 1988
386.121
+10.685
2.85%
jan 1, 1989
396.6
+10.479
2.71%
jan 1, 1990
411.689
+15.088
3.8%
jan 1, 1991
417.99
+6.302
1.53%
jan 1, 1992
418.742
+0.752
0.18%
jan 1, 1993
439.206
+20.463
4.89%
jan 1, 1994
450.547
+11.342
2.58%
jan 1, 1995
499.512
+48.965
10.87%
jan 1, 1996
512.518
+13.006
2.6%
jan 1, 1997
519.92
+7.403
1.44%
jan 1, 1998
527.568
+7.648
1.47%
jan 1, 1999
533.089
+5.521
1.05%
jan 1, 2000
542.613
+9.524
1.79%
jan 1, 2001
551.48
+8.867
1.63%
jan 1, 2002
553.606
+2.126
0.39%
jan 1, 2003
559.525
+5.919
1.07%
jan 1, 2004
573.335
+13.81
2.47%
jan 1, 2005
586.305
+12.971
2.26%
jan 1, 2006
602.406
+16.101
2.75%
jan 1, 2007
621.408
+19.002
3.15%
jan 1, 2008
634.418
+13.01
2.09%
jan 1, 2009
637.728
+3.31
0.52%
Ranking of countries by current statistics by years


Comments: