29
/
en
AIzaSyAYiBZKx7MnpbEhh9jyipgxe19OcubqV5w
April 1, 2024
282709
Vietnam
VNM
true
2
1
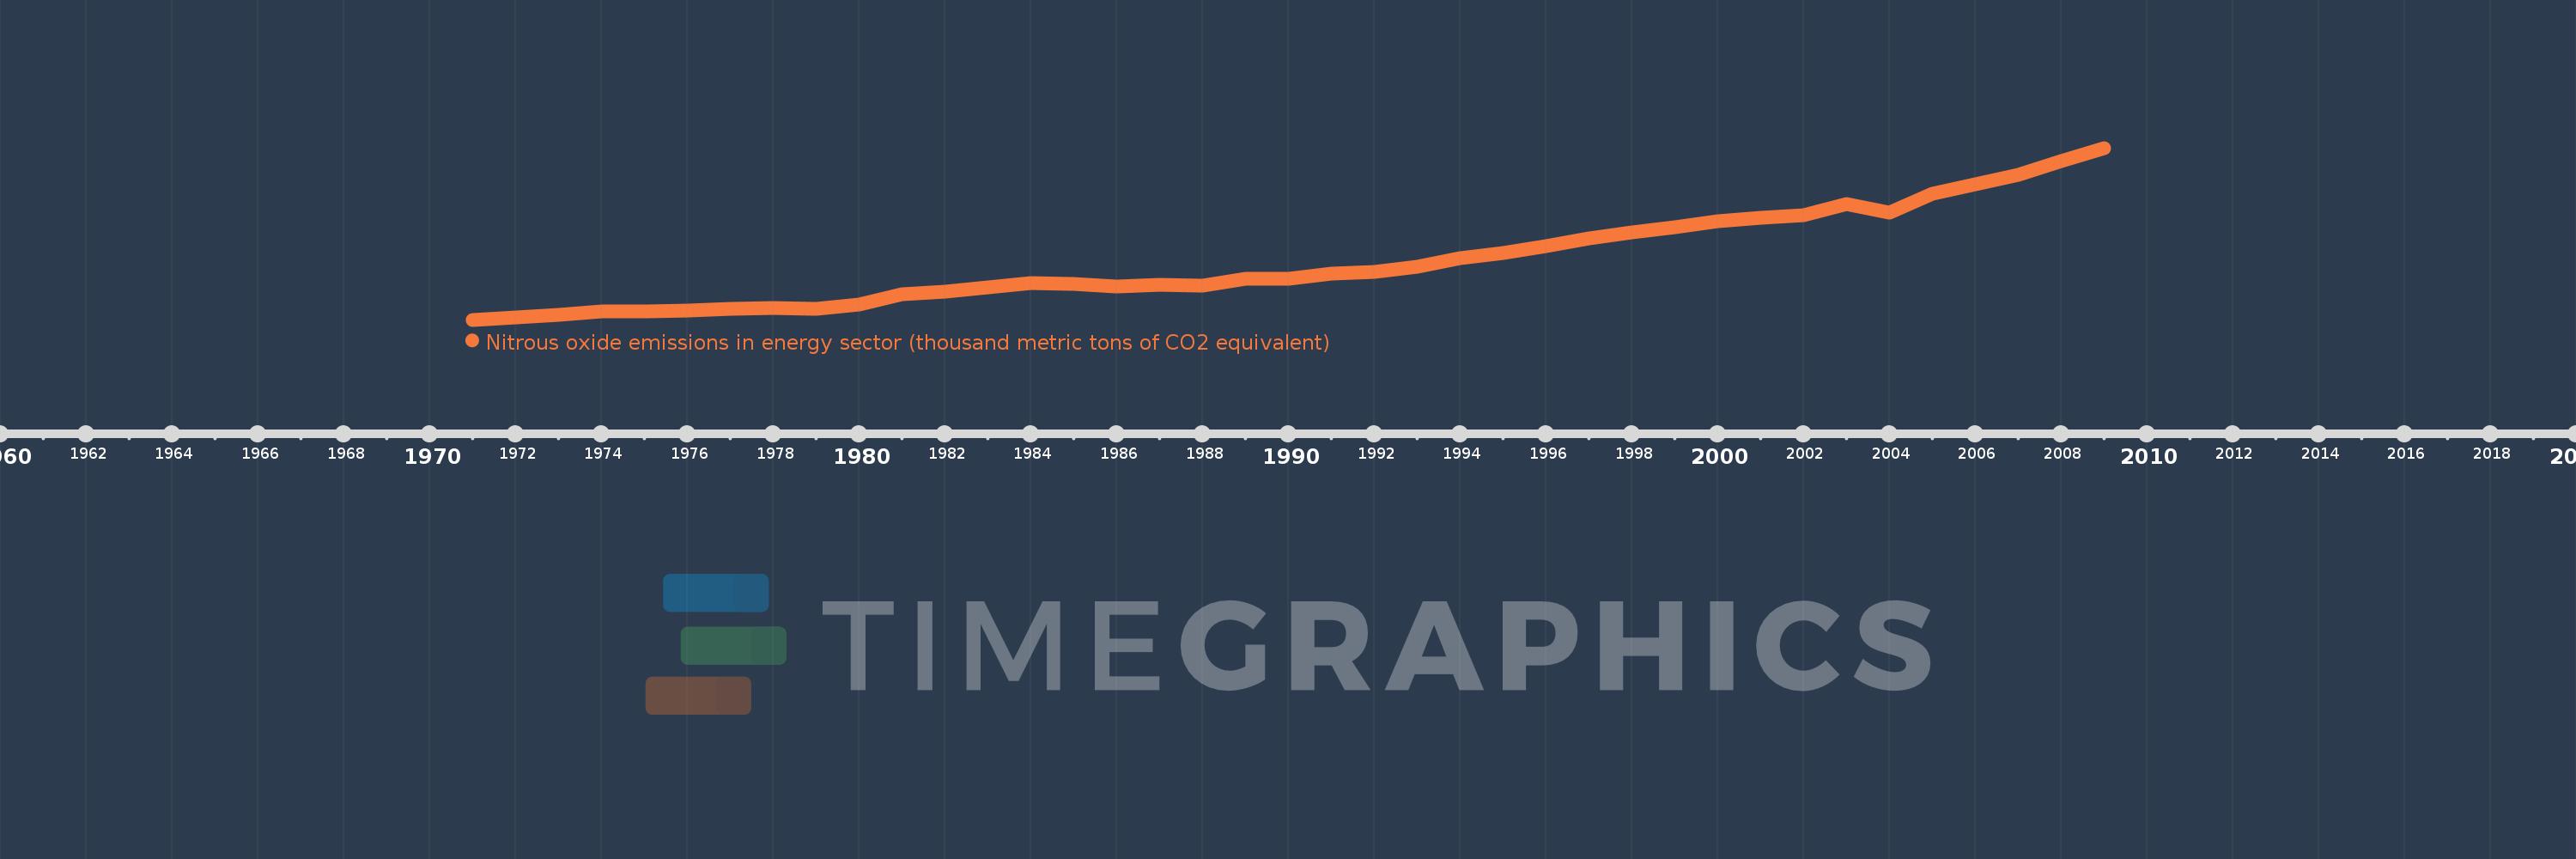
Nitrous oxide emissions in energy sector (thousand metric tons of CO2 equivalent)
2009,2008,2007,2006,2005,2004,2003,2002,2001,2000,1999,1998,1997,1996,1995,1994,1993,1992,1991,1990,1989,1988,1987,1986,1985,1984,1983,1982,1981,1980,1979,1978,1977,1976,1975,1974,1973,1972,1971
This statistics in other country:
AfghanistanAlbaniaAlgeriaAmerican SamoaAndorraAngolaAntigua and BarbudaArab WorldArgentinaArmeniaArubaAustraliaAustriaAzerbaijanBahamas, TheBahrainBangladeshBarbadosBelarusBelgiumBelizeBeninBermudaBhutanBoliviaBosnia and HerzegovinaBotswanaBrazilBritish Virgin IslandsBrunei DarussalamBulgariaBurkina FasoBurundiCabo VerdeCambodiaCameroonCanadaCaribbean small statesCayman IslandsCentral African RepublicCentral Europe and the BalticsChadChannel IslandsChileChinaColombiaComorosCongo, Dem. Rep.Congo, Rep.Costa RicaCote d'IvoireCroatiaCubaCuracaoCyprusCzech RepublicDenmarkDjiboutiDominicaDominican RepublicEarly-demographic dividendEast Asia & PacificEast Asia & Pacific (excluding high income)East Asia & Pacific (IDA & IBRD countries)EcuadorEgypt, Arab Rep.El SalvadorEquatorial GuineaEritreaEstoniaEthiopiaEuro areaEurope & Central AsiaEurope & Central Asia (excluding high income)Europe & Central Asia (IDA & IBRD countries)European UnionFaroe IslandsFijiFinlandFragile and conflict affected situationsFranceFrench PolynesiaGabonGambia, TheGeorgiaGermanyGhanaGibraltarGreeceGreenlandGrenadaGuamGuatemalaGuineaGuinea-BissauGuyanaHaitiHeavily indebted poor countries (HIPC)High incomeHondurasHong Kong SAR, ChinaHungaryIBRD onlyIcelandIDA & IBRD totalIDA blendIDA onlyIDA totalIndiaIndonesiaIran, Islamic Rep.IraqIrelandIsle of ManIsraelItalyJamaicaJapanJordanKazakhstanKenyaKiribatiKorea, Dem. People’s Rep.Korea, Rep.KosovoKuwaitKyrgyz RepublicLao PDRLate-demographic dividendLatin America & Caribbean Latin America & Caribbean (excluding high income)Latin America & the Caribbean (IDA & IBRD countries)LatviaLeast developed countries: UN classificationLebanonLesothoLiberiaLibyaLiechtensteinLithuaniaLow & middle incomeLow incomeLower middle incomeLuxembourgMacao SAR, ChinaMacedonia, FYRMadagascarMalawiMalaysiaMaldivesMaliMaltaMarshall IslandsMauritaniaMauritiusMexicoMicronesia, Fed. Sts.Middle East & North AfricaMiddle East & North Africa (excluding high income)Middle East & North Africa (IDA & IBRD countries)Middle incomeMoldovaMonacoMongoliaMontenegroMoroccoMozambiqueMyanmarNamibiaNauruNepalNetherlandsNew CaledoniaNew ZealandNicaraguaNigerNigeriaNorth AmericaNorthern Mariana IslandsNorwayOECD membersOmanOther small statesPacific island small statesPakistanPalauPanamaPapua New GuineaParaguayPeruPhilippinesPolandPortugalPost-demographic dividendPre-demographic dividendPuerto RicoQatarRomaniaRussian FederationRwandaSamoaSan MarinoSao Tome and PrincipeSaudi ArabiaSenegalSerbiaSeychellesSierra LeoneSingaporeSint Maarten (Dutch part)Slovak RepublicSloveniaSmall statesSolomon IslandsSomaliaSouth AfricaSouth AsiaSouth Asia (IDA & IBRD)South SudanSpainSri LankaSt. Kitts and NevisSt. LuciaSt. Martin (French part)St. Vincent and the GrenadinesSub-Saharan Africa Sub-Saharan Africa (excluding high income)Sub-Saharan Africa (IDA & IBRD countries)SudanSurinameSwazilandSwedenSwitzerlandSyrian Arab RepublicTajikistanTanzaniaThailandTimor-LesteTogoTongaTrinidad and TobagoTunisiaTurkeyTurkmenistanTurks and Caicos IslandsTuvaluUgandaUkraineUnited Arab EmiratesUnited KingdomUnited StatesUpper middle incomeUruguayUzbekistanVanuatuVenezuela, RBVietnamVirgin Islands (U.S.)West Bank and GazaWorldYemen, Rep.ZambiaZimbabwe Timeline:
This timeline shows a graph from 1971 to 2009 of Vietnam. No data until 1970. Number of actual observations by date: 39.
Source name:
World Development Indicators
Source organization:
European Commission, Joint Research Centre (JRC)/Netherlands Environmental Assessment Agency (PBL). Emission Database for Global Atmospheric Research (EDGAR): http://edgar.jrc.ec.europa.eu/
Categories, topics:
Energy & Mining, Environment
Last updated:
apr 23, 2017
Indicators value changes by year
Minimum:
576.272
jan 1, 1971
Maximum:
1.618K
jan 1, 2009
At the date of observation
Value
Absolute change
Change from previous value
jan 1, 1971
576.272
+576.272
0.0%
jan 1, 1972
589.399
+13.127
2.28%
jan 1, 1973
604.691
+15.292
2.59%
jan 1, 1974
625.953
+21.263
3.52%
jan 1, 1975
624.796
-1.157
-0.18%
jan 1, 1976
629.597
+4.801
0.77%
jan 1, 1977
640.565
+10.968
1.74%
jan 1, 1978
645.348
+4.783
0.75%
jan 1, 1979
644.219
-1.129
-0.17%
jan 1, 1980
670.459
+26.24
4.07%
jan 1, 1981
728.462
+58.003
8.65%
jan 1, 1982
744.443
+15.981
2.19%
jan 1, 1983
770.05
+25.606
3.44%
jan 1, 1984
800.507
+30.458
3.96%
jan 1, 1985
795.792
-4.715
-0.59%
jan 1, 1986
775.711
-20.081
-2.52%
jan 1, 1987
787.722
+12.011
1.55%
jan 1, 1988
785.271
-2.451
-0.31%
jan 1, 1989
824.145
+38.874
4.95%
jan 1, 1990
823.748
-0.397
-0.05%
jan 1, 1991
857.389
+33.641
4.08%
jan 1, 1992
868.492
+11.103
1.3%
jan 1, 1993
895.828
+27.336
3.15%
jan 1, 1994
950.097
+54.269
6.06%
jan 1, 1995
980.191
+30.093
3.17%
jan 1, 1996
1.023K
+42.558
4.34%
jan 1, 1997
1.068K
+45.375
4.44%
jan 1, 1998
1.107K
+38.629
3.62%
jan 1, 1999
1.136K
+28.754
2.6%
jan 1, 2000
1.171K
+35.657
3.14%
jan 1, 2001
1.196K
+24.434
2.09%
jan 1, 2002
1.21K
+14.112
1.18%
jan 1, 2003
1.275K
+65.41
5.41%
jan 1, 2004
1.228K
-47.559
-3.73%
jan 1, 2005
1.34K
+112.154
9.14%
jan 1, 2006
1.396K
+56.743
4.24%
jan 1, 2007
1.453K
+56.193
4.02%
jan 1, 2008
1.54K
+87.599
6.03%
jan 1, 2009
1.618K
+77.316
5.02%
Ranking of countries by current statistics by years


Comments: