29
/
en
AIzaSyAYiBZKx7MnpbEhh9jyipgxe19OcubqV5w
April 1, 2024
160842
Israel
ISR
true
2
1
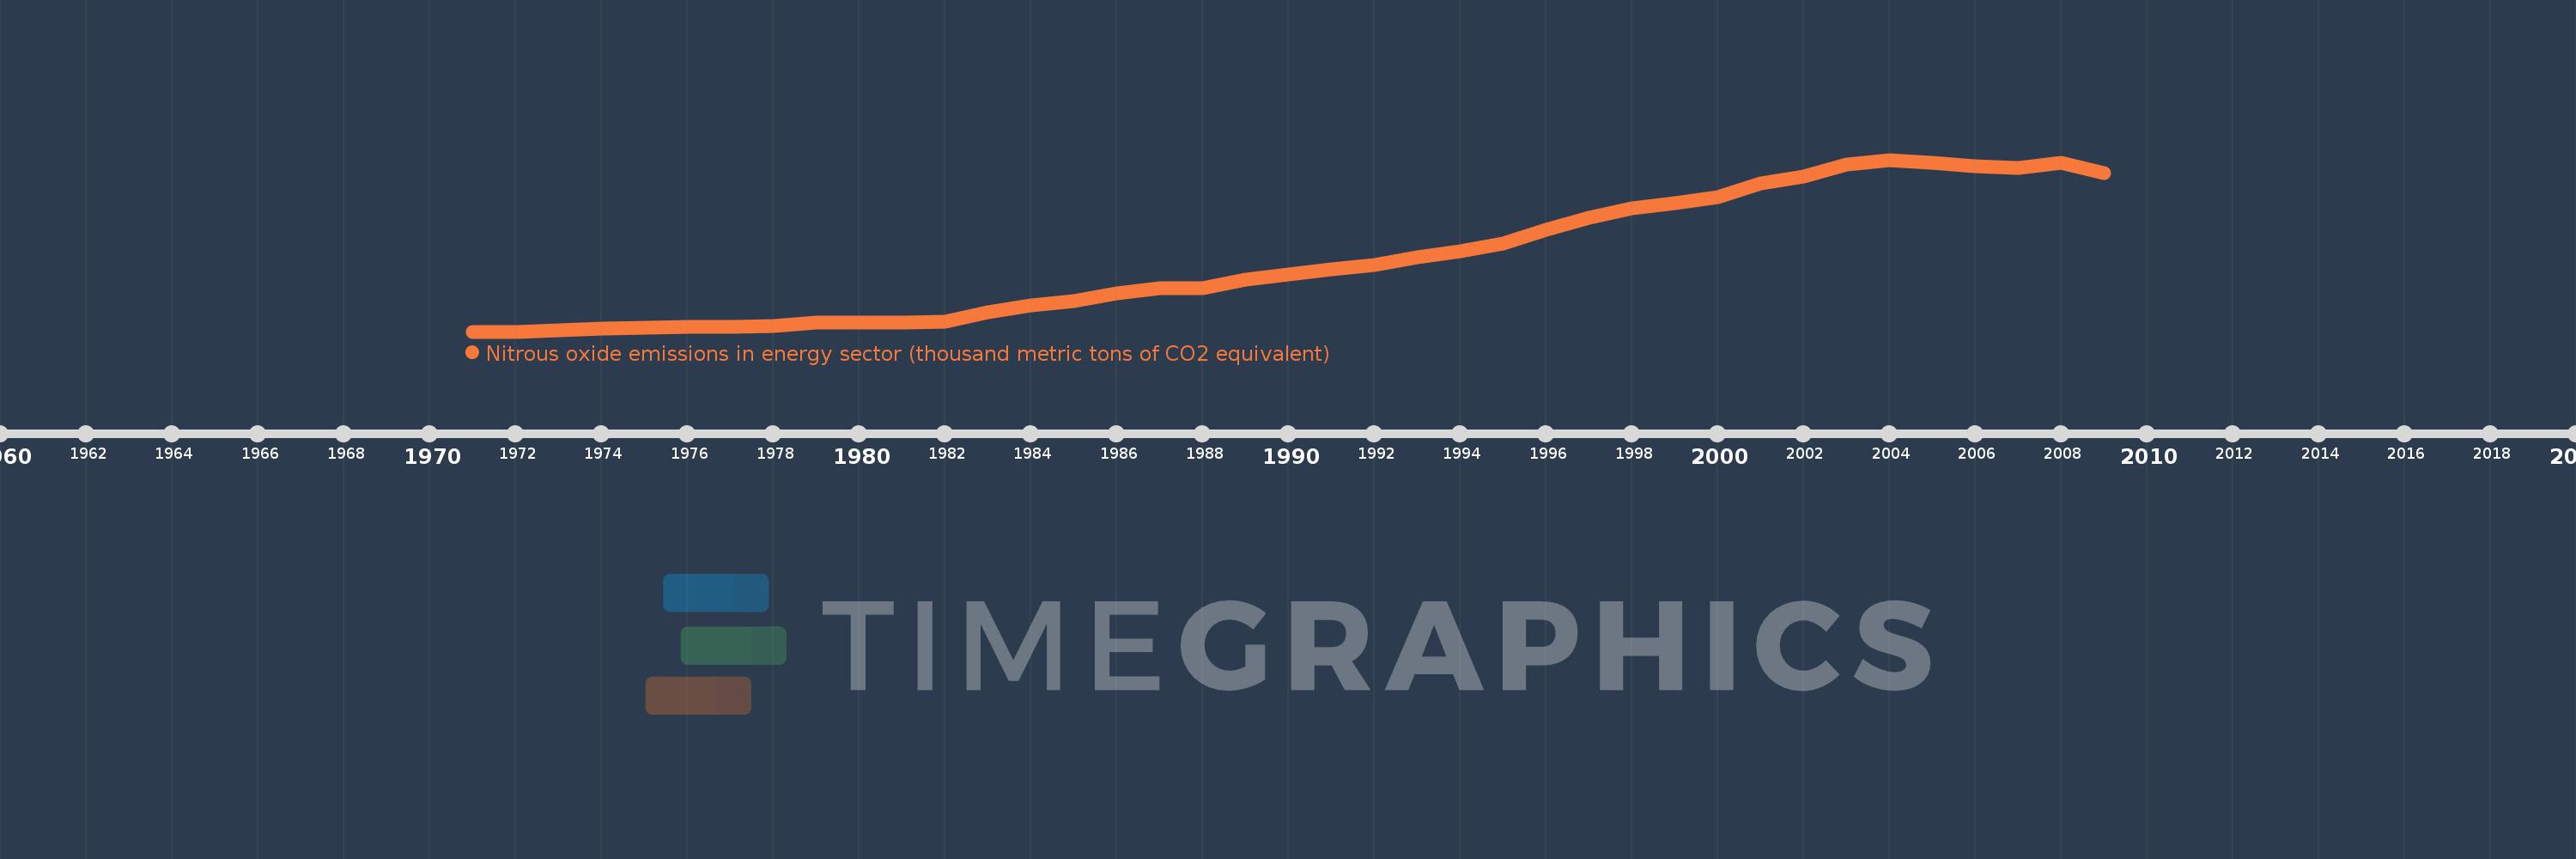
Nitrous oxide emissions in energy sector (thousand metric tons of CO2 equivalent)
2009,2008,2007,2006,2005,2004,2003,2002,2001,2000,1999,1998,1997,1996,1995,1994,1993,1992,1991,1990,1989,1988,1987,1986,1985,1984,1983,1982,1981,1980,1979,1978,1977,1976,1975,1974,1973,1972,1971
This statistics in other country:
AfghanistanAlbaniaAlgeriaAmerican SamoaAndorraAngolaAntigua and BarbudaArab WorldArgentinaArmeniaArubaAustraliaAustriaAzerbaijanBahamas, TheBahrainBangladeshBarbadosBelarusBelgiumBelizeBeninBermudaBhutanBoliviaBosnia and HerzegovinaBotswanaBrazilBritish Virgin IslandsBrunei DarussalamBulgariaBurkina FasoBurundiCabo VerdeCambodiaCameroonCanadaCaribbean small statesCayman IslandsCentral African RepublicCentral Europe and the BalticsChadChannel IslandsChileChinaColombiaComorosCongo, Dem. Rep.Congo, Rep.Costa RicaCote d'IvoireCroatiaCubaCuracaoCyprusCzech RepublicDenmarkDjiboutiDominicaDominican RepublicEarly-demographic dividendEast Asia & PacificEast Asia & Pacific (excluding high income)East Asia & Pacific (IDA & IBRD countries)EcuadorEgypt, Arab Rep.El SalvadorEquatorial GuineaEritreaEstoniaEthiopiaEuro areaEurope & Central AsiaEurope & Central Asia (excluding high income)Europe & Central Asia (IDA & IBRD countries)European UnionFaroe IslandsFijiFinlandFragile and conflict affected situationsFranceFrench PolynesiaGabonGambia, TheGeorgiaGermanyGhanaGibraltarGreeceGreenlandGrenadaGuamGuatemalaGuineaGuinea-BissauGuyanaHaitiHeavily indebted poor countries (HIPC)High incomeHondurasHong Kong SAR, ChinaHungaryIBRD onlyIcelandIDA & IBRD totalIDA blendIDA onlyIDA totalIndiaIndonesiaIran, Islamic Rep.IraqIrelandIsle of ManIsraelItalyJamaicaJapanJordanKazakhstanKenyaKiribatiKorea, Dem. People’s Rep.Korea, Rep.KosovoKuwaitKyrgyz RepublicLao PDRLate-demographic dividendLatin America & Caribbean Latin America & Caribbean (excluding high income)Latin America & the Caribbean (IDA & IBRD countries)LatviaLeast developed countries: UN classificationLebanonLesothoLiberiaLibyaLiechtensteinLithuaniaLow & middle incomeLow incomeLower middle incomeLuxembourgMacao SAR, ChinaMacedonia, FYRMadagascarMalawiMalaysiaMaldivesMaliMaltaMarshall IslandsMauritaniaMauritiusMexicoMicronesia, Fed. Sts.Middle East & North AfricaMiddle East & North Africa (excluding high income)Middle East & North Africa (IDA & IBRD countries)Middle incomeMoldovaMonacoMongoliaMontenegroMoroccoMozambiqueMyanmarNamibiaNauruNepalNetherlandsNew CaledoniaNew ZealandNicaraguaNigerNigeriaNorth AmericaNorthern Mariana IslandsNorwayOECD membersOmanOther small statesPacific island small statesPakistanPalauPanamaPapua New GuineaParaguayPeruPhilippinesPolandPortugalPost-demographic dividendPre-demographic dividendPuerto RicoQatarRomaniaRussian FederationRwandaSamoaSan MarinoSao Tome and PrincipeSaudi ArabiaSenegalSerbiaSeychellesSierra LeoneSingaporeSint Maarten (Dutch part)Slovak RepublicSloveniaSmall statesSolomon IslandsSomaliaSouth AfricaSouth AsiaSouth Asia (IDA & IBRD)South SudanSpainSri LankaSt. Kitts and NevisSt. LuciaSt. Martin (French part)St. Vincent and the GrenadinesSub-Saharan Africa Sub-Saharan Africa (excluding high income)Sub-Saharan Africa (IDA & IBRD countries)SudanSurinameSwazilandSwedenSwitzerlandSyrian Arab RepublicTajikistanTanzaniaThailandTimor-LesteTogoTongaTrinidad and TobagoTunisiaTurkeyTurkmenistanTurks and Caicos IslandsTuvaluUgandaUkraineUnited Arab EmiratesUnited KingdomUnited StatesUpper middle incomeUruguayUzbekistanVanuatuVenezuela, RBVietnamVirgin Islands (U.S.)West Bank and GazaWorldYemen, Rep.ZambiaZimbabwe Timeline:
This timeline shows a graph from 1971 to 2009 of Israel. No data until 1970. Number of actual observations by date: 39.
Source name:
World Development Indicators
Source organization:
European Commission, Joint Research Centre (JRC)/Netherlands Environmental Assessment Agency (PBL). Emission Database for Global Atmospheric Research (EDGAR): http://edgar.jrc.ec.europa.eu/
Categories, topics:
Energy & Mining, Environment
Last updated:
apr 23, 2017
Indicators value changes by year
Minimum:
44.992
jan 1, 1971
Maximum:
294.532
jan 1, 2004
At the date of observation
Value
Absolute change
Change from previous value
jan 1, 1971
44.992
+44.992
0.0%
jan 1, 1972
44.992
0.0
0.0%
jan 1, 1973
46.775
+1.783
3.96%
jan 1, 1974
49.889
+3.114
6.66%
jan 1, 1975
50.013
+0.124
0.25%
jan 1, 1976
51.269
+1.256
2.51%
jan 1, 1977
51.594
+0.325
0.63%
jan 1, 1978
53.489
+1.895
3.67%
jan 1, 1979
57.607
+4.118
7.7%
jan 1, 1980
58.552
+0.945
1.64%
jan 1, 1981
57.962
-0.59
-1.01%
jan 1, 1982
59.866
+1.904
3.28%
jan 1, 1983
73.682
+13.816
23.08%
jan 1, 1984
82.963
+9.28
12.6%
jan 1, 1985
89.89
+6.927
8.35%
jan 1, 1986
100.001
+10.111
11.25%
jan 1, 1987
107.545
+7.545
7.54%
jan 1, 1988
107.65
+0.105
0.1%
jan 1, 1989
121.079
+13.429
12.47%
jan 1, 1990
128.136
+7.057
5.83%
jan 1, 1991
135.839
+7.703
6.01%
jan 1, 1992
141.683
+5.844
4.3%
jan 1, 1993
152.655
+10.971
7.74%
jan 1, 1994
162.062
+9.407
6.16%
jan 1, 1995
173.282
+11.22
6.92%
jan 1, 1996
193.046
+19.763
11.41%
jan 1, 1997
210.376
+17.33
8.98%
jan 1, 1998
224.219
+13.844
6.58%
jan 1, 1999
230.921
+6.702
2.99%
jan 1, 2000
240.775
+9.854
4.27%
jan 1, 2001
260.81
+20.035
8.32%
jan 1, 2002
270.417
+9.607
3.68%
jan 1, 2003
288.127
+17.71
6.55%
jan 1, 2004
294.532
+6.405
2.22%
jan 1, 2005
289.589
-4.943
-1.68%
jan 1, 2006
284.864
-4.725
-1.63%
jan 1, 2007
282.383
-2.481
-0.87%
jan 1, 2008
289.808
+7.425
2.63%
jan 1, 2009
275.426
-14.382
-4.96%
Ranking of countries by current statistics by years


Comments: