29
/
en
AIzaSyAYiBZKx7MnpbEhh9jyipgxe19OcubqV5w
April 1, 2024
99018
Cambodia
KHM
true
2
1
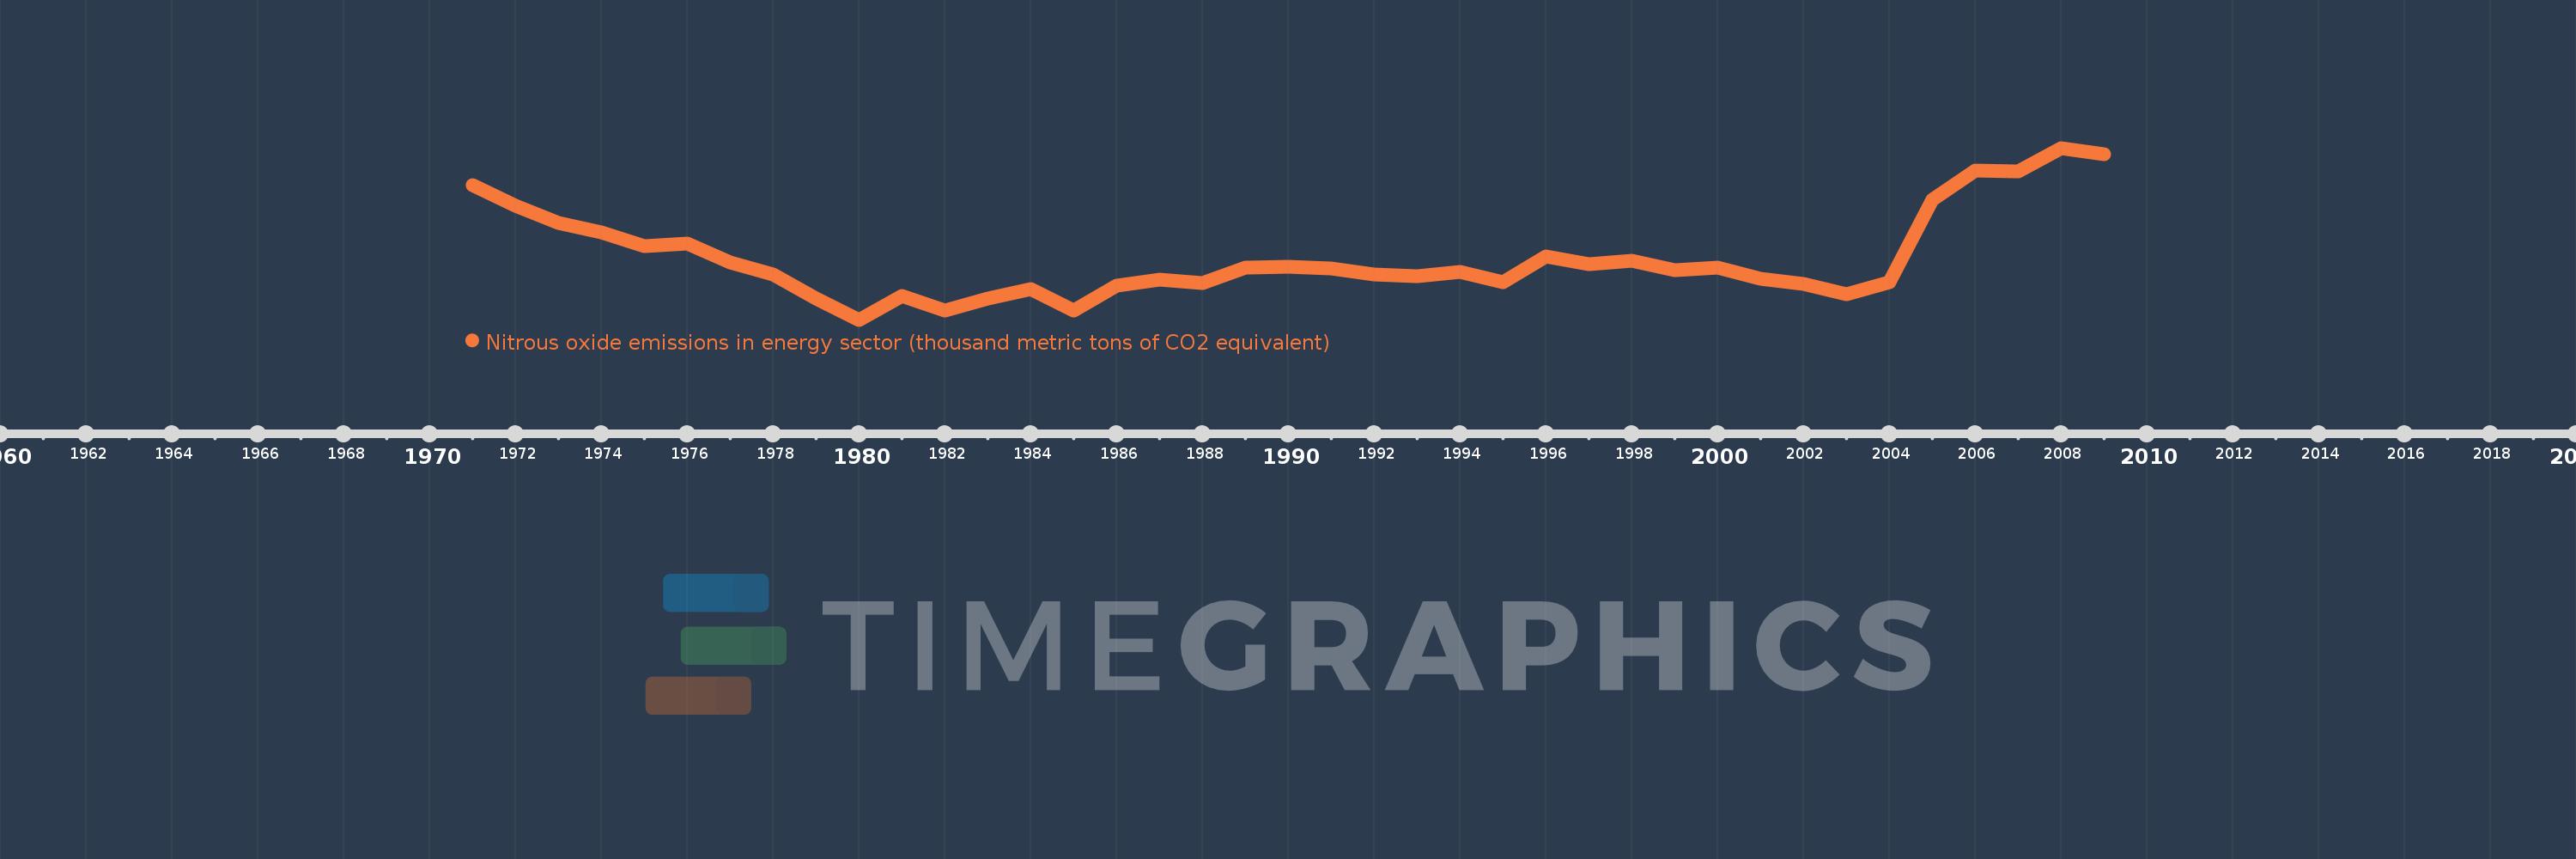
Nitrous oxide emissions in energy sector (thousand metric tons of CO2 equivalent)
2009,2008,2007,2006,2005,2004,2003,2002,2001,2000,1999,1998,1997,1996,1995,1994,1993,1992,1991,1990,1989,1988,1987,1986,1985,1984,1983,1982,1981,1980,1979,1978,1977,1976,1975,1974,1973,1972,1971
This statistics in other country:
AfghanistanAlbaniaAlgeriaAmerican SamoaAndorraAngolaAntigua and BarbudaArab WorldArgentinaArmeniaArubaAustraliaAustriaAzerbaijanBahamas, TheBahrainBangladeshBarbadosBelarusBelgiumBelizeBeninBermudaBhutanBoliviaBosnia and HerzegovinaBotswanaBrazilBritish Virgin IslandsBrunei DarussalamBulgariaBurkina FasoBurundiCabo VerdeCambodiaCameroonCanadaCaribbean small statesCayman IslandsCentral African RepublicCentral Europe and the BalticsChadChannel IslandsChileChinaColombiaComorosCongo, Dem. Rep.Congo, Rep.Costa RicaCote d'IvoireCroatiaCubaCuracaoCyprusCzech RepublicDenmarkDjiboutiDominicaDominican RepublicEarly-demographic dividendEast Asia & PacificEast Asia & Pacific (excluding high income)East Asia & Pacific (IDA & IBRD countries)EcuadorEgypt, Arab Rep.El SalvadorEquatorial GuineaEritreaEstoniaEthiopiaEuro areaEurope & Central AsiaEurope & Central Asia (excluding high income)Europe & Central Asia (IDA & IBRD countries)European UnionFaroe IslandsFijiFinlandFragile and conflict affected situationsFranceFrench PolynesiaGabonGambia, TheGeorgiaGermanyGhanaGibraltarGreeceGreenlandGrenadaGuamGuatemalaGuineaGuinea-BissauGuyanaHaitiHeavily indebted poor countries (HIPC)High incomeHondurasHong Kong SAR, ChinaHungaryIBRD onlyIcelandIDA & IBRD totalIDA blendIDA onlyIDA totalIndiaIndonesiaIran, Islamic Rep.IraqIrelandIsle of ManIsraelItalyJamaicaJapanJordanKazakhstanKenyaKiribatiKorea, Dem. People’s Rep.Korea, Rep.KosovoKuwaitKyrgyz RepublicLao PDRLate-demographic dividendLatin America & Caribbean Latin America & Caribbean (excluding high income)Latin America & the Caribbean (IDA & IBRD countries)LatviaLeast developed countries: UN classificationLebanonLesothoLiberiaLibyaLiechtensteinLithuaniaLow & middle incomeLow incomeLower middle incomeLuxembourgMacao SAR, ChinaMacedonia, FYRMadagascarMalawiMalaysiaMaldivesMaliMaltaMarshall IslandsMauritaniaMauritiusMexicoMicronesia, Fed. Sts.Middle East & North AfricaMiddle East & North Africa (excluding high income)Middle East & North Africa (IDA & IBRD countries)Middle incomeMoldovaMonacoMongoliaMontenegroMoroccoMozambiqueMyanmarNamibiaNauruNepalNetherlandsNew CaledoniaNew ZealandNicaraguaNigerNigeriaNorth AmericaNorthern Mariana IslandsNorwayOECD membersOmanOther small statesPacific island small statesPakistanPalauPanamaPapua New GuineaParaguayPeruPhilippinesPolandPortugalPost-demographic dividendPre-demographic dividendPuerto RicoQatarRomaniaRussian FederationRwandaSamoaSan MarinoSao Tome and PrincipeSaudi ArabiaSenegalSerbiaSeychellesSierra LeoneSingaporeSint Maarten (Dutch part)Slovak RepublicSloveniaSmall statesSolomon IslandsSomaliaSouth AfricaSouth AsiaSouth Asia (IDA & IBRD)South SudanSpainSri LankaSt. Kitts and NevisSt. LuciaSt. Martin (French part)St. Vincent and the GrenadinesSub-Saharan Africa Sub-Saharan Africa (excluding high income)Sub-Saharan Africa (IDA & IBRD countries)SudanSurinameSwazilandSwedenSwitzerlandSyrian Arab RepublicTajikistanTanzaniaThailandTimor-LesteTogoTongaTrinidad and TobagoTunisiaTurkeyTurkmenistanTurks and Caicos IslandsTuvaluUgandaUkraineUnited Arab EmiratesUnited KingdomUnited StatesUpper middle incomeUruguayUzbekistanVanuatuVenezuela, RBVietnamVirgin Islands (U.S.)West Bank and GazaWorldYemen, Rep.ZambiaZimbabwe Timeline:
This timeline shows a graph from 1971 to 2009 of Cambodia. No data until 1970. Number of actual observations by date: 39.
Source name:
World Development Indicators
Source organization:
European Commission, Joint Research Centre (JRC)/Netherlands Environmental Assessment Agency (PBL). Emission Database for Global Atmospheric Research (EDGAR): http://edgar.jrc.ec.europa.eu/
Categories, topics:
Energy & Mining, Environment
Last updated:
apr 23, 2017
Indicators value changes by year
Minimum:
188.723
jan 1, 1980
Maximum:
260.461
jan 1, 2008
At the date of observation
Value
Absolute change
Change from previous value
jan 1, 1971
244.814
+244.814
0.0%
jan 1, 1972
236.499
-8.315
-3.4%
jan 1, 1973
229.285
-7.214
-3.05%
jan 1, 1974
225.026
-4.259
-1.86%
jan 1, 1975
219.365
-5.661
-2.52%
jan 1, 1976
220.607
+1.243
0.57%
jan 1, 1977
212.577
-8.03
-3.64%
jan 1, 1978
207.592
-4.986
-2.35%
jan 1, 1979
197.643
-9.949
-4.79%
jan 1, 1980
188.723
-8.92
-4.51%
jan 1, 1981
198.813
+10.09
5.35%
jan 1, 1982
192.42
-6.393
-3.22%
jan 1, 1983
197.498
+5.078
2.64%
jan 1, 1984
201.434
+3.935
1.99%
jan 1, 1985
192.388
-9.045
-4.49%
jan 1, 1986
202.894
+10.506
5.46%
jan 1, 1987
205.361
+2.467
1.22%
jan 1, 1988
203.965
-1.395
-0.68%
jan 1, 1989
210.587
+6.622
3.25%
jan 1, 1990
210.952
+0.365
0.17%
jan 1, 1991
210.184
-0.769
-0.36%
jan 1, 1992
207.721
-2.463
-1.17%
jan 1, 1993
206.863
-0.858
-0.41%
jan 1, 1994
208.672
+1.808
0.87%
jan 1, 1995
204.55
-4.122
-1.98%
jan 1, 1996
215.079
+10.529
5.15%
jan 1, 1997
212.094
-2.985
-1.39%
jan 1, 1998
213.189
+1.095
0.52%
jan 1, 1999
209.545
-3.644
-1.71%
jan 1, 2000
210.626
+1.081
0.52%
jan 1, 2001
205.827
-4.799
-2.28%
jan 1, 2002
203.732
-2.095
-1.02%
jan 1, 2003
199.406
-4.326
-2.12%
jan 1, 2004
204.464
+5.058
2.54%
jan 1, 2005
238.85
+34.385
16.82%
jan 1, 2006
250.984
+12.135
5.08%
jan 1, 2007
250.61
-0.375
-0.15%
jan 1, 2008
260.461
+9.851
3.93%
jan 1, 2009
257.88
-2.58
-0.99%
Ranking of countries by current statistics by years


Comments: