29
/
en
AIzaSyAYiBZKx7MnpbEhh9jyipgxe19OcubqV5w
April 1, 2024
209623
New Zealand
NZL
true
2
1
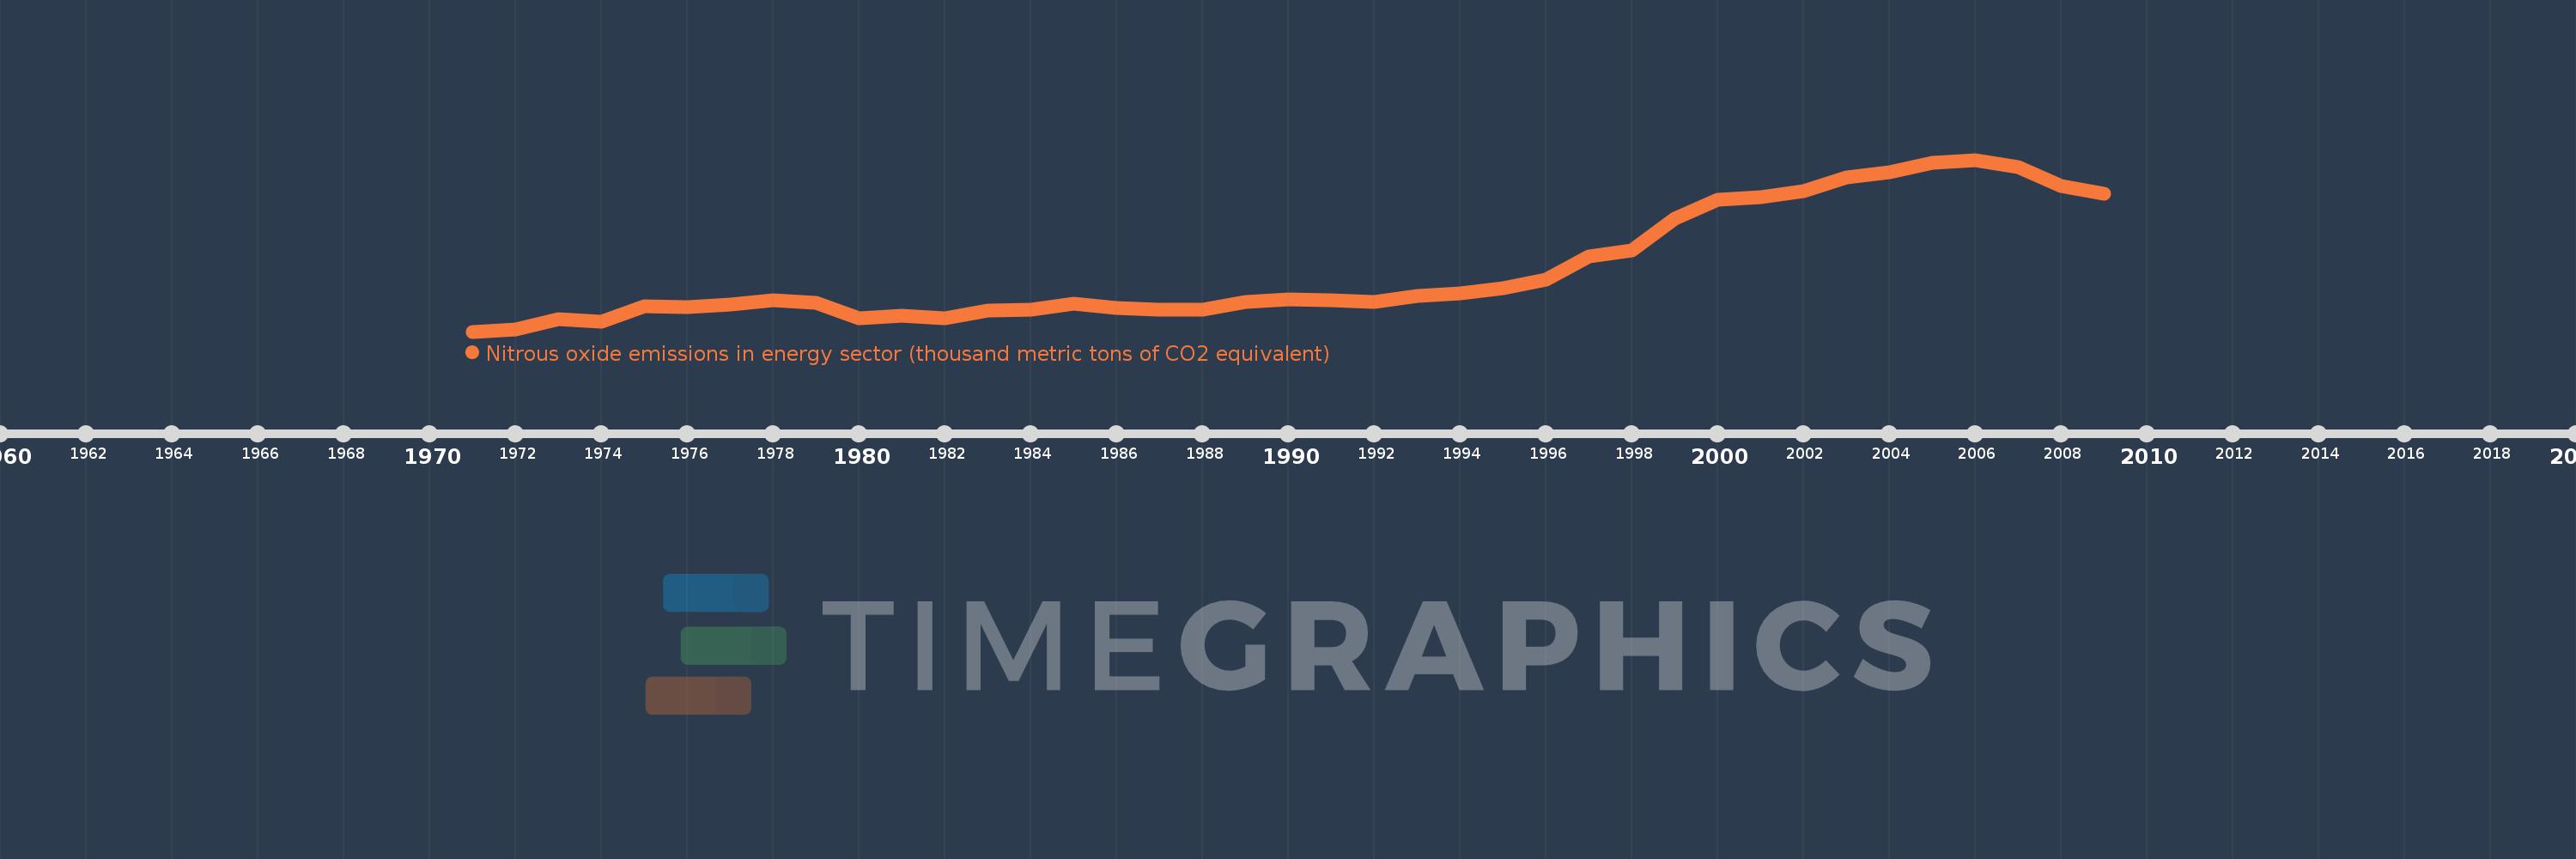
Nitrous oxide emissions in energy sector (thousand metric tons of CO2 equivalent)
2009,2008,2007,2006,2005,2004,2003,2002,2001,2000,1999,1998,1997,1996,1995,1994,1993,1992,1991,1990,1989,1988,1987,1986,1985,1984,1983,1982,1981,1980,1979,1978,1977,1976,1975,1974,1973,1972,1971
This statistics in other country:
AfghanistanAlbaniaAlgeriaAmerican SamoaAndorraAngolaAntigua and BarbudaArab WorldArgentinaArmeniaArubaAustraliaAustriaAzerbaijanBahamas, TheBahrainBangladeshBarbadosBelarusBelgiumBelizeBeninBermudaBhutanBoliviaBosnia and HerzegovinaBotswanaBrazilBritish Virgin IslandsBrunei DarussalamBulgariaBurkina FasoBurundiCabo VerdeCambodiaCameroonCanadaCaribbean small statesCayman IslandsCentral African RepublicCentral Europe and the BalticsChadChannel IslandsChileChinaColombiaComorosCongo, Dem. Rep.Congo, Rep.Costa RicaCote d'IvoireCroatiaCubaCuracaoCyprusCzech RepublicDenmarkDjiboutiDominicaDominican RepublicEarly-demographic dividendEast Asia & PacificEast Asia & Pacific (excluding high income)East Asia & Pacific (IDA & IBRD countries)EcuadorEgypt, Arab Rep.El SalvadorEquatorial GuineaEritreaEstoniaEthiopiaEuro areaEurope & Central AsiaEurope & Central Asia (excluding high income)Europe & Central Asia (IDA & IBRD countries)European UnionFaroe IslandsFijiFinlandFragile and conflict affected situationsFranceFrench PolynesiaGabonGambia, TheGeorgiaGermanyGhanaGibraltarGreeceGreenlandGrenadaGuamGuatemalaGuineaGuinea-BissauGuyanaHaitiHeavily indebted poor countries (HIPC)High incomeHondurasHong Kong SAR, ChinaHungaryIBRD onlyIcelandIDA & IBRD totalIDA blendIDA onlyIDA totalIndiaIndonesiaIran, Islamic Rep.IraqIrelandIsle of ManIsraelItalyJamaicaJapanJordanKazakhstanKenyaKiribatiKorea, Dem. People’s Rep.Korea, Rep.KosovoKuwaitKyrgyz RepublicLao PDRLate-demographic dividendLatin America & Caribbean Latin America & Caribbean (excluding high income)Latin America & the Caribbean (IDA & IBRD countries)LatviaLeast developed countries: UN classificationLebanonLesothoLiberiaLibyaLiechtensteinLithuaniaLow & middle incomeLow incomeLower middle incomeLuxembourgMacao SAR, ChinaMacedonia, FYRMadagascarMalawiMalaysiaMaldivesMaliMaltaMarshall IslandsMauritaniaMauritiusMexicoMicronesia, Fed. Sts.Middle East & North AfricaMiddle East & North Africa (excluding high income)Middle East & North Africa (IDA & IBRD countries)Middle incomeMoldovaMonacoMongoliaMontenegroMoroccoMozambiqueMyanmarNamibiaNauruNepalNetherlandsNew CaledoniaNew ZealandNicaraguaNigerNigeriaNorth AmericaNorthern Mariana IslandsNorwayOECD membersOmanOther small statesPacific island small statesPakistanPalauPanamaPapua New GuineaParaguayPeruPhilippinesPolandPortugalPost-demographic dividendPre-demographic dividendPuerto RicoQatarRomaniaRussian FederationRwandaSamoaSan MarinoSao Tome and PrincipeSaudi ArabiaSenegalSerbiaSeychellesSierra LeoneSingaporeSint Maarten (Dutch part)Slovak RepublicSloveniaSmall statesSolomon IslandsSomaliaSouth AfricaSouth AsiaSouth Asia (IDA & IBRD)South SudanSpainSri LankaSt. Kitts and NevisSt. LuciaSt. Martin (French part)St. Vincent and the GrenadinesSub-Saharan Africa Sub-Saharan Africa (excluding high income)Sub-Saharan Africa (IDA & IBRD countries)SudanSurinameSwazilandSwedenSwitzerlandSyrian Arab RepublicTajikistanTanzaniaThailandTimor-LesteTogoTongaTrinidad and TobagoTunisiaTurkeyTurkmenistanTurks and Caicos IslandsTuvaluUgandaUkraineUnited Arab EmiratesUnited KingdomUnited StatesUpper middle incomeUruguayUzbekistanVanuatuVenezuela, RBVietnamVirgin Islands (U.S.)West Bank and GazaWorldYemen, Rep.ZambiaZimbabwe Timeline:
This timeline shows a graph from 1971 to 2009 of New Zealand. No data until 1970. Number of actual observations by date: 39.
Source name:
World Development Indicators
Source organization:
European Commission, Joint Research Centre (JRC)/Netherlands Environmental Assessment Agency (PBL). Emission Database for Global Atmospheric Research (EDGAR): http://edgar.jrc.ec.europa.eu/
Categories, topics:
Energy & Mining, Environment
Last updated:
apr 23, 2017
Indicators value changes by year
Minimum:
140.647
jan 1, 1971
Maximum:
338.218
jan 1, 2006
At the date of observation
Value
Absolute change
Change from previous value
jan 1, 1971
140.647
+140.647
0.0%
jan 1, 1972
143.525
+2.878
2.05%
jan 1, 1973
155.04
+11.516
8.02%
jan 1, 1974
152.085
-2.956
-1.91%
jan 1, 1975
169.711
+17.626
11.59%
jan 1, 1976
169.193
-0.518
-0.31%
jan 1, 1977
171.638
+2.445
1.44%
jan 1, 1978
176.548
+4.91
2.86%
jan 1, 1979
173.503
-3.044
-1.72%
jan 1, 1980
156.184
-17.319
-9.98%
jan 1, 1981
159.089
+2.905
1.86%
jan 1, 1982
156.182
-2.907
-1.83%
jan 1, 1983
164.505
+8.323
5.33%
jan 1, 1984
165.742
+1.236
0.75%
jan 1, 1985
173.106
+7.364
4.44%
jan 1, 1986
168.073
-5.033
-2.91%
jan 1, 1987
165.691
-2.382
-1.42%
jan 1, 1988
165.962
+0.271
0.16%
jan 1, 1989
175.206
+9.244
5.57%
jan 1, 1990
177.665
+2.459
1.4%
jan 1, 1991
176.498
-1.168
-0.66%
jan 1, 1992
174.838
-1.66
-0.94%
jan 1, 1993
181.554
+6.716
3.84%
jan 1, 1994
184.397
+2.843
1.57%
jan 1, 1995
190.492
+6.094
3.31%
jan 1, 1996
200.777
+10.286
5.4%
jan 1, 1997
226.694
+25.917
12.91%
jan 1, 1998
233.702
+7.008
3.09%
jan 1, 1999
270.675
+36.972
15.82%
jan 1, 2000
292.356
+21.681
8.01%
jan 1, 2001
295.498
+3.142
1.07%
jan 1, 2002
302.638
+7.14
2.42%
jan 1, 2003
318.102
+15.464
5.11%
jan 1, 2004
324.388
+6.286
1.98%
jan 1, 2005
334.734
+10.346
3.19%
jan 1, 2006
338.218
+3.484
1.04%
jan 1, 2007
329.997
-8.221
-2.43%
jan 1, 2008
308.003
-21.994
-6.66%
jan 1, 2009
298.841
-9.162
-2.97%
Ranking of countries by current statistics by years


Comments: