29
/
en
AIzaSyAYiBZKx7MnpbEhh9jyipgxe19OcubqV5w
April 1, 2024
105271
Chile
CHL
true
2
1
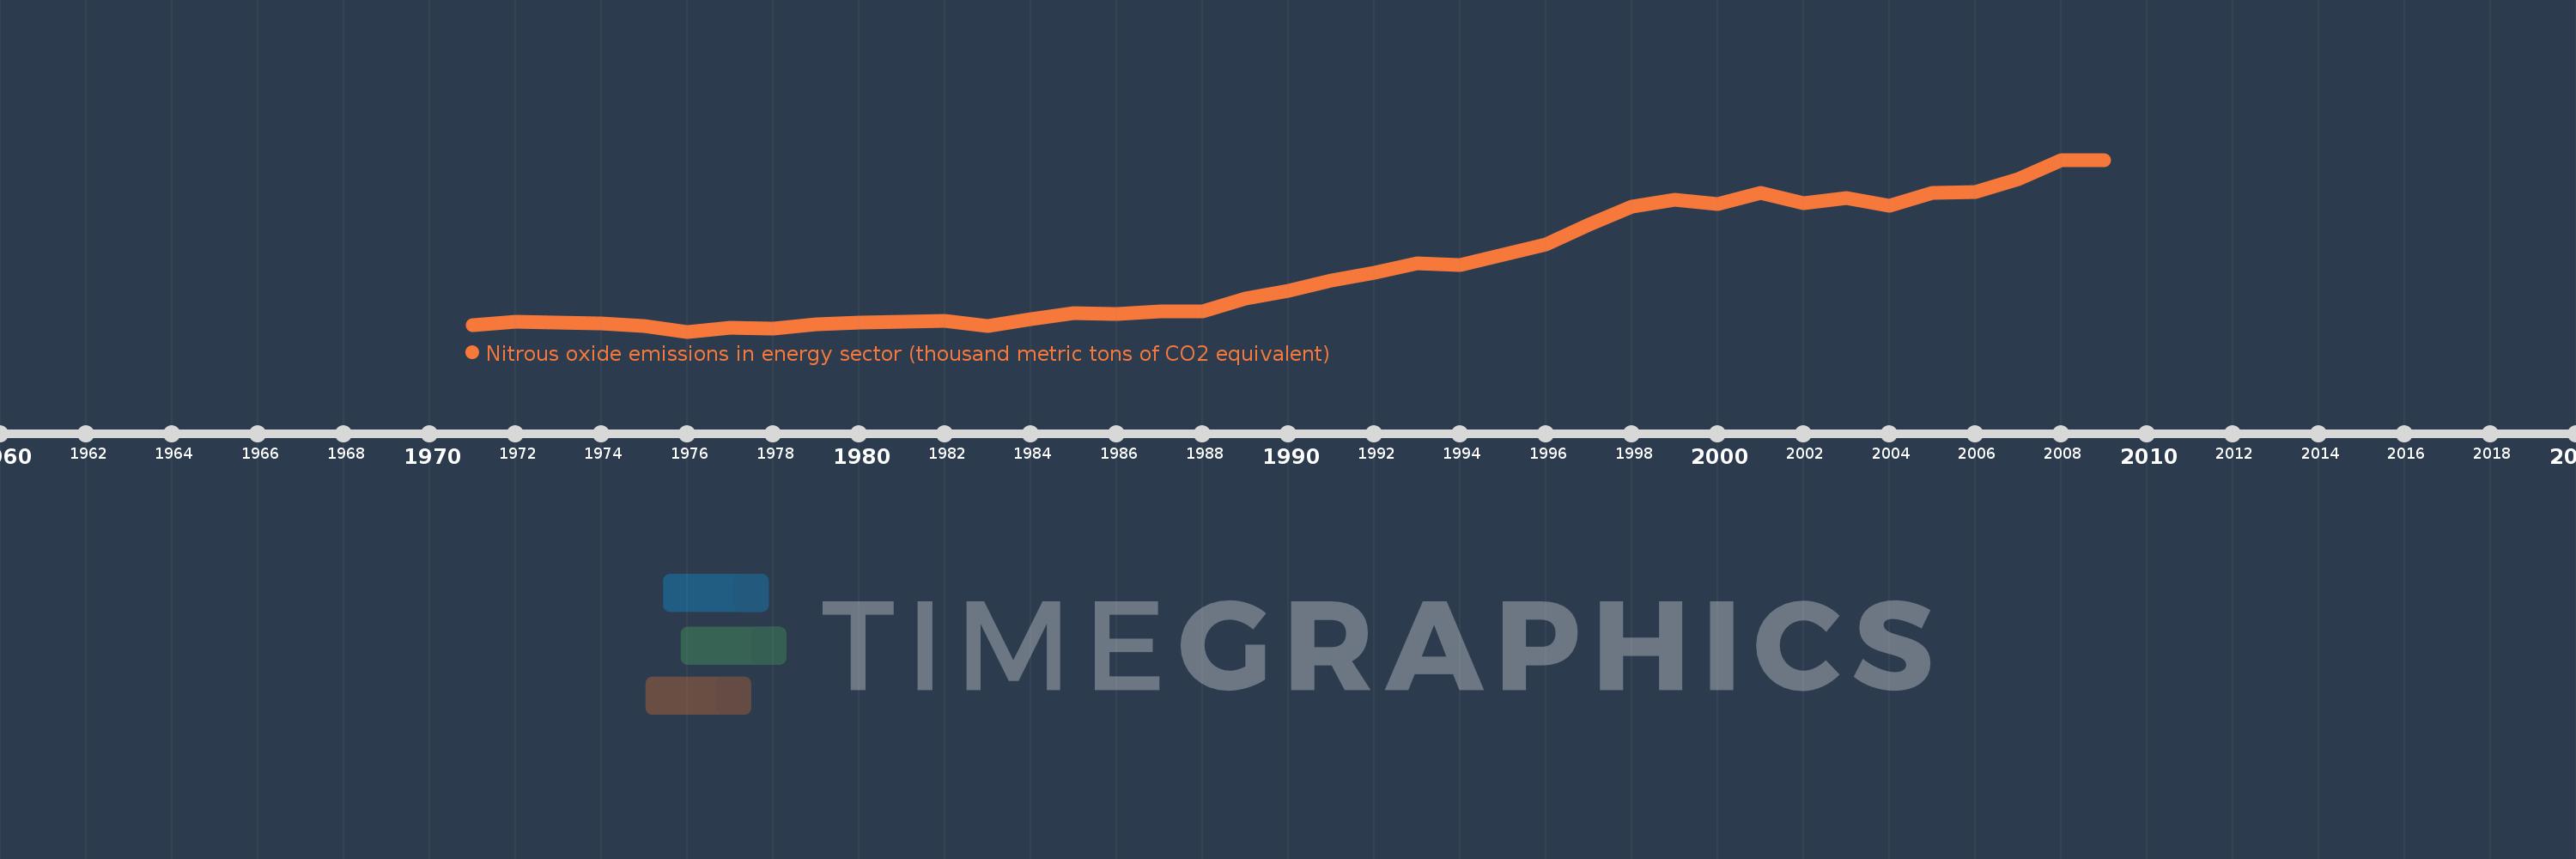
Nitrous oxide emissions in energy sector (thousand metric tons of CO2 equivalent)
2009,2008,2007,2006,2005,2004,2003,2002,2001,2000,1999,1998,1997,1996,1995,1994,1993,1992,1991,1990,1989,1988,1987,1986,1985,1984,1983,1982,1981,1980,1979,1978,1977,1976,1975,1974,1973,1972,1971
This statistics in other country:
AfghanistanAlbaniaAlgeriaAmerican SamoaAndorraAngolaAntigua and BarbudaArab WorldArgentinaArmeniaArubaAustraliaAustriaAzerbaijanBahamas, TheBahrainBangladeshBarbadosBelarusBelgiumBelizeBeninBermudaBhutanBoliviaBosnia and HerzegovinaBotswanaBrazilBritish Virgin IslandsBrunei DarussalamBulgariaBurkina FasoBurundiCabo VerdeCambodiaCameroonCanadaCaribbean small statesCayman IslandsCentral African RepublicCentral Europe and the BalticsChadChannel IslandsChileChinaColombiaComorosCongo, Dem. Rep.Congo, Rep.Costa RicaCote d'IvoireCroatiaCubaCuracaoCyprusCzech RepublicDenmarkDjiboutiDominicaDominican RepublicEarly-demographic dividendEast Asia & PacificEast Asia & Pacific (excluding high income)East Asia & Pacific (IDA & IBRD countries)EcuadorEgypt, Arab Rep.El SalvadorEquatorial GuineaEritreaEstoniaEthiopiaEuro areaEurope & Central AsiaEurope & Central Asia (excluding high income)Europe & Central Asia (IDA & IBRD countries)European UnionFaroe IslandsFijiFinlandFragile and conflict affected situationsFranceFrench PolynesiaGabonGambia, TheGeorgiaGermanyGhanaGibraltarGreeceGreenlandGrenadaGuamGuatemalaGuineaGuinea-BissauGuyanaHaitiHeavily indebted poor countries (HIPC)High incomeHondurasHong Kong SAR, ChinaHungaryIBRD onlyIcelandIDA & IBRD totalIDA blendIDA onlyIDA totalIndiaIndonesiaIran, Islamic Rep.IraqIrelandIsle of ManIsraelItalyJamaicaJapanJordanKazakhstanKenyaKiribatiKorea, Dem. People’s Rep.Korea, Rep.KosovoKuwaitKyrgyz RepublicLao PDRLate-demographic dividendLatin America & Caribbean Latin America & Caribbean (excluding high income)Latin America & the Caribbean (IDA & IBRD countries)LatviaLeast developed countries: UN classificationLebanonLesothoLiberiaLibyaLiechtensteinLithuaniaLow & middle incomeLow incomeLower middle incomeLuxembourgMacao SAR, ChinaMacedonia, FYRMadagascarMalawiMalaysiaMaldivesMaliMaltaMarshall IslandsMauritaniaMauritiusMexicoMicronesia, Fed. Sts.Middle East & North AfricaMiddle East & North Africa (excluding high income)Middle East & North Africa (IDA & IBRD countries)Middle incomeMoldovaMonacoMongoliaMontenegroMoroccoMozambiqueMyanmarNamibiaNauruNepalNetherlandsNew CaledoniaNew ZealandNicaraguaNigerNigeriaNorth AmericaNorthern Mariana IslandsNorwayOECD membersOmanOther small statesPacific island small statesPakistanPalauPanamaPapua New GuineaParaguayPeruPhilippinesPolandPortugalPost-demographic dividendPre-demographic dividendPuerto RicoQatarRomaniaRussian FederationRwandaSamoaSan MarinoSao Tome and PrincipeSaudi ArabiaSenegalSerbiaSeychellesSierra LeoneSingaporeSint Maarten (Dutch part)Slovak RepublicSloveniaSmall statesSolomon IslandsSomaliaSouth AfricaSouth AsiaSouth Asia (IDA & IBRD)South SudanSpainSri LankaSt. Kitts and NevisSt. LuciaSt. Martin (French part)St. Vincent and the GrenadinesSub-Saharan Africa Sub-Saharan Africa (excluding high income)Sub-Saharan Africa (IDA & IBRD countries)SudanSurinameSwazilandSwedenSwitzerlandSyrian Arab RepublicTajikistanTanzaniaThailandTimor-LesteTogoTongaTrinidad and TobagoTunisiaTurkeyTurkmenistanTurks and Caicos IslandsTuvaluUgandaUkraineUnited Arab EmiratesUnited KingdomUnited StatesUpper middle incomeUruguayUzbekistanVanuatuVenezuela, RBVietnamVirgin Islands (U.S.)West Bank and GazaWorldYemen, Rep.ZambiaZimbabwe Timeline:
This timeline shows a graph from 1971 to 2009 of Chile. No data until 1970. Number of actual observations by date: 39.
Source name:
World Development Indicators
Source organization:
European Commission, Joint Research Centre (JRC)/Netherlands Environmental Assessment Agency (PBL). Emission Database for Global Atmospheric Research (EDGAR): http://edgar.jrc.ec.europa.eu/
Categories, topics:
Energy & Mining, Environment
Last updated:
apr 23, 2017
Indicators value changes by year
Minimum:
171.608
jan 1, 1976
Maximum:
558.901
jan 1, 2008
At the date of observation
Value
Absolute change
Change from previous value
jan 1, 1971
187.08
+187.08
0.0%
jan 1, 1972
193.589
+6.508
3.48%
jan 1, 1973
192.739
-0.85
-0.44%
jan 1, 1974
189.082
-3.657
-1.9%
jan 1, 1975
183.917
-5.165
-2.73%
jan 1, 1976
171.608
-12.308
-6.69%
jan 1, 1977
179.828
+8.22
4.79%
jan 1, 1978
178.676
-1.152
-0.64%
jan 1, 1979
187.979
+9.302
5.21%
jan 1, 1980
191.658
+3.68
1.96%
jan 1, 1981
194.591
+2.933
1.53%
jan 1, 1982
194.851
+0.26
0.13%
jan 1, 1983
183.809
-11.042
-5.67%
jan 1, 1984
198.918
+15.109
8.22%
jan 1, 1985
212.508
+13.589
6.83%
jan 1, 1986
211.346
-1.162
-0.55%
jan 1, 1987
217.631
+6.285
2.97%
jan 1, 1988
217.44
-0.191
-0.09%
jan 1, 1989
245.598
+28.158
12.95%
jan 1, 1990
264.448
+18.849
7.67%
jan 1, 1991
287.676
+23.229
8.78%
jan 1, 1992
304.839
+17.163
5.97%
jan 1, 1993
325.579
+20.74
6.8%
jan 1, 1994
321.228
-4.351
-1.34%
jan 1, 1995
344.751
+23.523
7.32%
jan 1, 1996
368.794
+24.043
6.97%
jan 1, 1997
412.856
+44.062
11.95%
jan 1, 1998
453.375
+40.519
9.81%
jan 1, 1999
468.895
+15.519
3.42%
jan 1, 2000
459.29
-9.605
-2.05%
jan 1, 2001
483.787
+24.496
5.33%
jan 1, 2002
461.256
-22.531
-4.66%
jan 1, 2003
472.265
+11.009
2.39%
jan 1, 2004
455.634
-16.631
-3.52%
jan 1, 2005
485.141
+29.507
6.48%
jan 1, 2006
485.84
+0.7
0.14%
jan 1, 2007
515.741
+29.9
6.15%
jan 1, 2008
558.901
+43.161
8.37%
jan 1, 2009
558.036
-0.866
-0.15%
Ranking of countries by current statistics by years


Comments: