29
/
en
AIzaSyAYiBZKx7MnpbEhh9jyipgxe19OcubqV5w
April 1, 2024
182402
Luxembourg
LUX
true
2
1
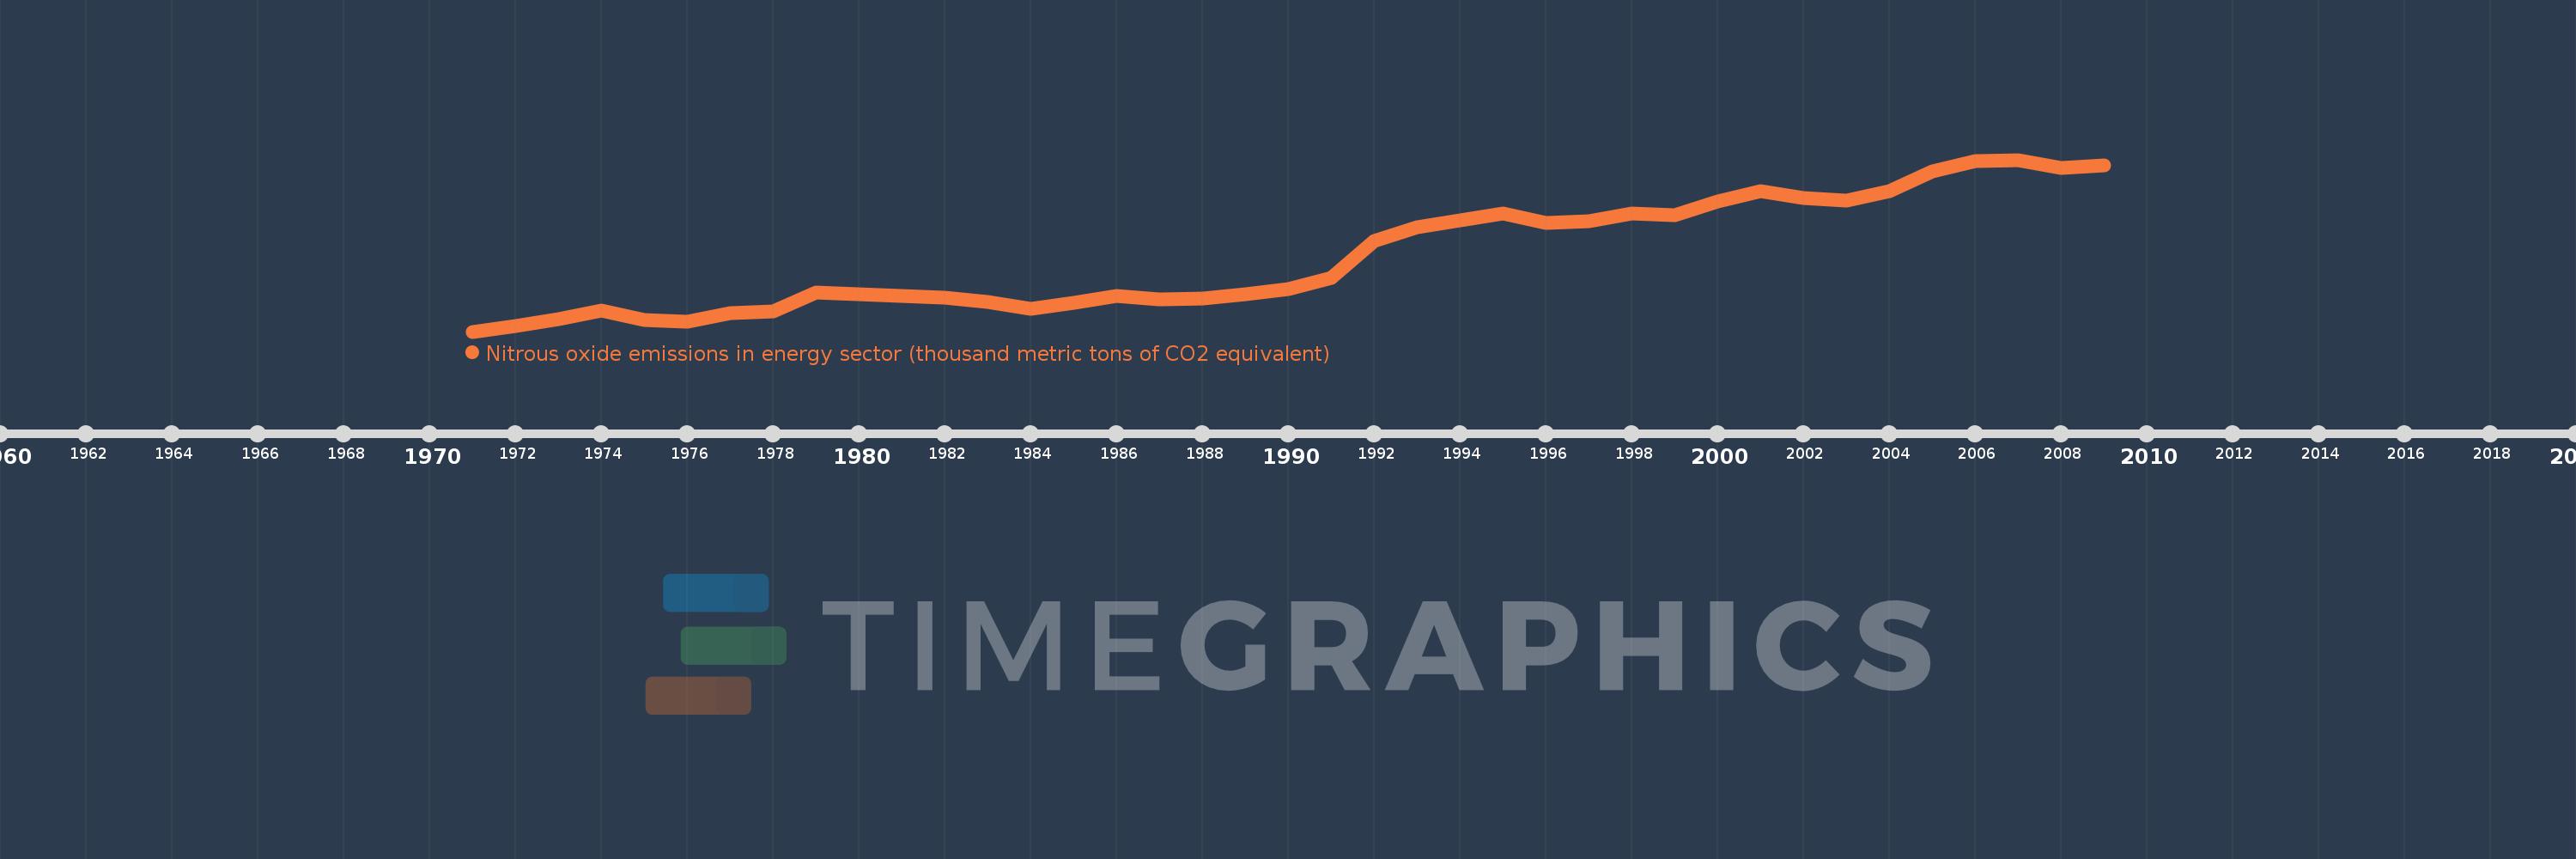
Nitrous oxide emissions in energy sector (thousand metric tons of CO2 equivalent)
2009,2008,2007,2006,2005,2004,2003,2002,2001,2000,1999,1998,1997,1996,1995,1994,1993,1992,1991,1990,1989,1988,1987,1986,1985,1984,1983,1982,1981,1980,1979,1978,1977,1976,1975,1974,1973,1972,1971
This statistics in other country:
AfghanistanAlbaniaAlgeriaAmerican SamoaAndorraAngolaAntigua and BarbudaArab WorldArgentinaArmeniaArubaAustraliaAustriaAzerbaijanBahamas, TheBahrainBangladeshBarbadosBelarusBelgiumBelizeBeninBermudaBhutanBoliviaBosnia and HerzegovinaBotswanaBrazilBritish Virgin IslandsBrunei DarussalamBulgariaBurkina FasoBurundiCabo VerdeCambodiaCameroonCanadaCaribbean small statesCayman IslandsCentral African RepublicCentral Europe and the BalticsChadChannel IslandsChileChinaColombiaComorosCongo, Dem. Rep.Congo, Rep.Costa RicaCote d'IvoireCroatiaCubaCuracaoCyprusCzech RepublicDenmarkDjiboutiDominicaDominican RepublicEarly-demographic dividendEast Asia & PacificEast Asia & Pacific (excluding high income)East Asia & Pacific (IDA & IBRD countries)EcuadorEgypt, Arab Rep.El SalvadorEquatorial GuineaEritreaEstoniaEthiopiaEuro areaEurope & Central AsiaEurope & Central Asia (excluding high income)Europe & Central Asia (IDA & IBRD countries)European UnionFaroe IslandsFijiFinlandFragile and conflict affected situationsFranceFrench PolynesiaGabonGambia, TheGeorgiaGermanyGhanaGibraltarGreeceGreenlandGrenadaGuamGuatemalaGuineaGuinea-BissauGuyanaHaitiHeavily indebted poor countries (HIPC)High incomeHondurasHong Kong SAR, ChinaHungaryIBRD onlyIcelandIDA & IBRD totalIDA blendIDA onlyIDA totalIndiaIndonesiaIran, Islamic Rep.IraqIrelandIsle of ManIsraelItalyJamaicaJapanJordanKazakhstanKenyaKiribatiKorea, Dem. People’s Rep.Korea, Rep.KosovoKuwaitKyrgyz RepublicLao PDRLate-demographic dividendLatin America & Caribbean Latin America & Caribbean (excluding high income)Latin America & the Caribbean (IDA & IBRD countries)LatviaLeast developed countries: UN classificationLebanonLesothoLiberiaLibyaLiechtensteinLithuaniaLow & middle incomeLow incomeLower middle incomeLuxembourgMacao SAR, ChinaMacedonia, FYRMadagascarMalawiMalaysiaMaldivesMaliMaltaMarshall IslandsMauritaniaMauritiusMexicoMicronesia, Fed. Sts.Middle East & North AfricaMiddle East & North Africa (excluding high income)Middle East & North Africa (IDA & IBRD countries)Middle incomeMoldovaMonacoMongoliaMontenegroMoroccoMozambiqueMyanmarNamibiaNauruNepalNetherlandsNew CaledoniaNew ZealandNicaraguaNigerNigeriaNorth AmericaNorthern Mariana IslandsNorwayOECD membersOmanOther small statesPacific island small statesPakistanPalauPanamaPapua New GuineaParaguayPeruPhilippinesPolandPortugalPost-demographic dividendPre-demographic dividendPuerto RicoQatarRomaniaRussian FederationRwandaSamoaSan MarinoSao Tome and PrincipeSaudi ArabiaSenegalSerbiaSeychellesSierra LeoneSingaporeSint Maarten (Dutch part)Slovak RepublicSloveniaSmall statesSolomon IslandsSomaliaSouth AfricaSouth AsiaSouth Asia (IDA & IBRD)South SudanSpainSri LankaSt. Kitts and NevisSt. LuciaSt. Martin (French part)St. Vincent and the GrenadinesSub-Saharan Africa Sub-Saharan Africa (excluding high income)Sub-Saharan Africa (IDA & IBRD countries)SudanSurinameSwazilandSwedenSwitzerlandSyrian Arab RepublicTajikistanTanzaniaThailandTimor-LesteTogoTongaTrinidad and TobagoTunisiaTurkeyTurkmenistanTurks and Caicos IslandsTuvaluUgandaUkraineUnited Arab EmiratesUnited KingdomUnited StatesUpper middle incomeUruguayUzbekistanVanuatuVenezuela, RBVietnamVirgin Islands (U.S.)West Bank and GazaWorldYemen, Rep.ZambiaZimbabwe Timeline:
This timeline shows a graph from 1971 to 2009 of Luxembourg. No data until 1970. Number of actual observations by date: 39.
Source name:
World Development Indicators
Source organization:
European Commission, Joint Research Centre (JRC)/Netherlands Environmental Assessment Agency (PBL). Emission Database for Global Atmospheric Research (EDGAR): http://edgar.jrc.ec.europa.eu/
Categories, topics:
Energy & Mining, Environment
Last updated:
apr 23, 2017
Indicators value changes by year
Minimum:
27.293
jan 1, 1971
Maximum:
84.315
jan 1, 2007
At the date of observation
Value
Absolute change
Change from previous value
jan 1, 1971
27.293
+27.293
0.0%
jan 1, 1972
29.09
+1.797
6.58%
jan 1, 1973
31.54
+2.451
8.42%
jan 1, 1974
34.371
+2.831
8.98%
jan 1, 1975
31.028
-3.343
-9.73%
jan 1, 1976
30.485
-0.543
-1.75%
jan 1, 1977
33.374
+2.889
9.48%
jan 1, 1978
34.003
+0.629
1.88%
jan 1, 1979
40.327
+6.324
18.6%
jan 1, 1980
39.691
-0.635
-1.58%
jan 1, 1981
39.234
-0.457
-1.15%
jan 1, 1982
38.481
-0.754
-1.92%
jan 1, 1983
37.072
-1.409
-3.66%
jan 1, 1984
34.739
-2.333
-6.29%
jan 1, 1985
36.787
+2.048
5.9%
jan 1, 1986
39.057
+2.27
6.17%
jan 1, 1987
37.933
-1.124
-2.88%
jan 1, 1988
38.199
+0.267
0.7%
jan 1, 1989
39.628
+1.429
3.74%
jan 1, 1990
41.505
+1.877
4.74%
jan 1, 1991
45.163
+3.658
8.81%
jan 1, 1992
57.347
+12.184
26.98%
jan 1, 1993
61.992
+4.645
8.1%
jan 1, 1994
64.199
+2.207
3.56%
jan 1, 1995
66.592
+2.393
3.73%
jan 1, 1996
63.344
-3.248
-4.88%
jan 1, 1997
63.976
+0.632
1.0%
jan 1, 1998
66.477
+2.501
3.91%
jan 1, 1999
66.025
-0.452
-0.68%
jan 1, 2000
70.49
+4.464
6.76%
jan 1, 2001
74.013
+3.523
5.0%
jan 1, 2002
71.73
-2.283
-3.08%
jan 1, 2003
70.659
-1.071
-1.49%
jan 1, 2004
73.881
+3.222
4.56%
jan 1, 2005
80.367
+6.486
8.78%
jan 1, 2006
83.987
+3.619
4.5%
jan 1, 2007
84.315
+0.328
0.39%
jan 1, 2008
81.737
-2.578
-3.06%
jan 1, 2009
82.427
+0.69
0.84%
Ranking of countries by current statistics by years


Comments: