29
/
en
AIzaSyAYiBZKx7MnpbEhh9jyipgxe19OcubqV5w
April 1, 2024
258724
Syrian Arab Republic
SYR
true
2
1
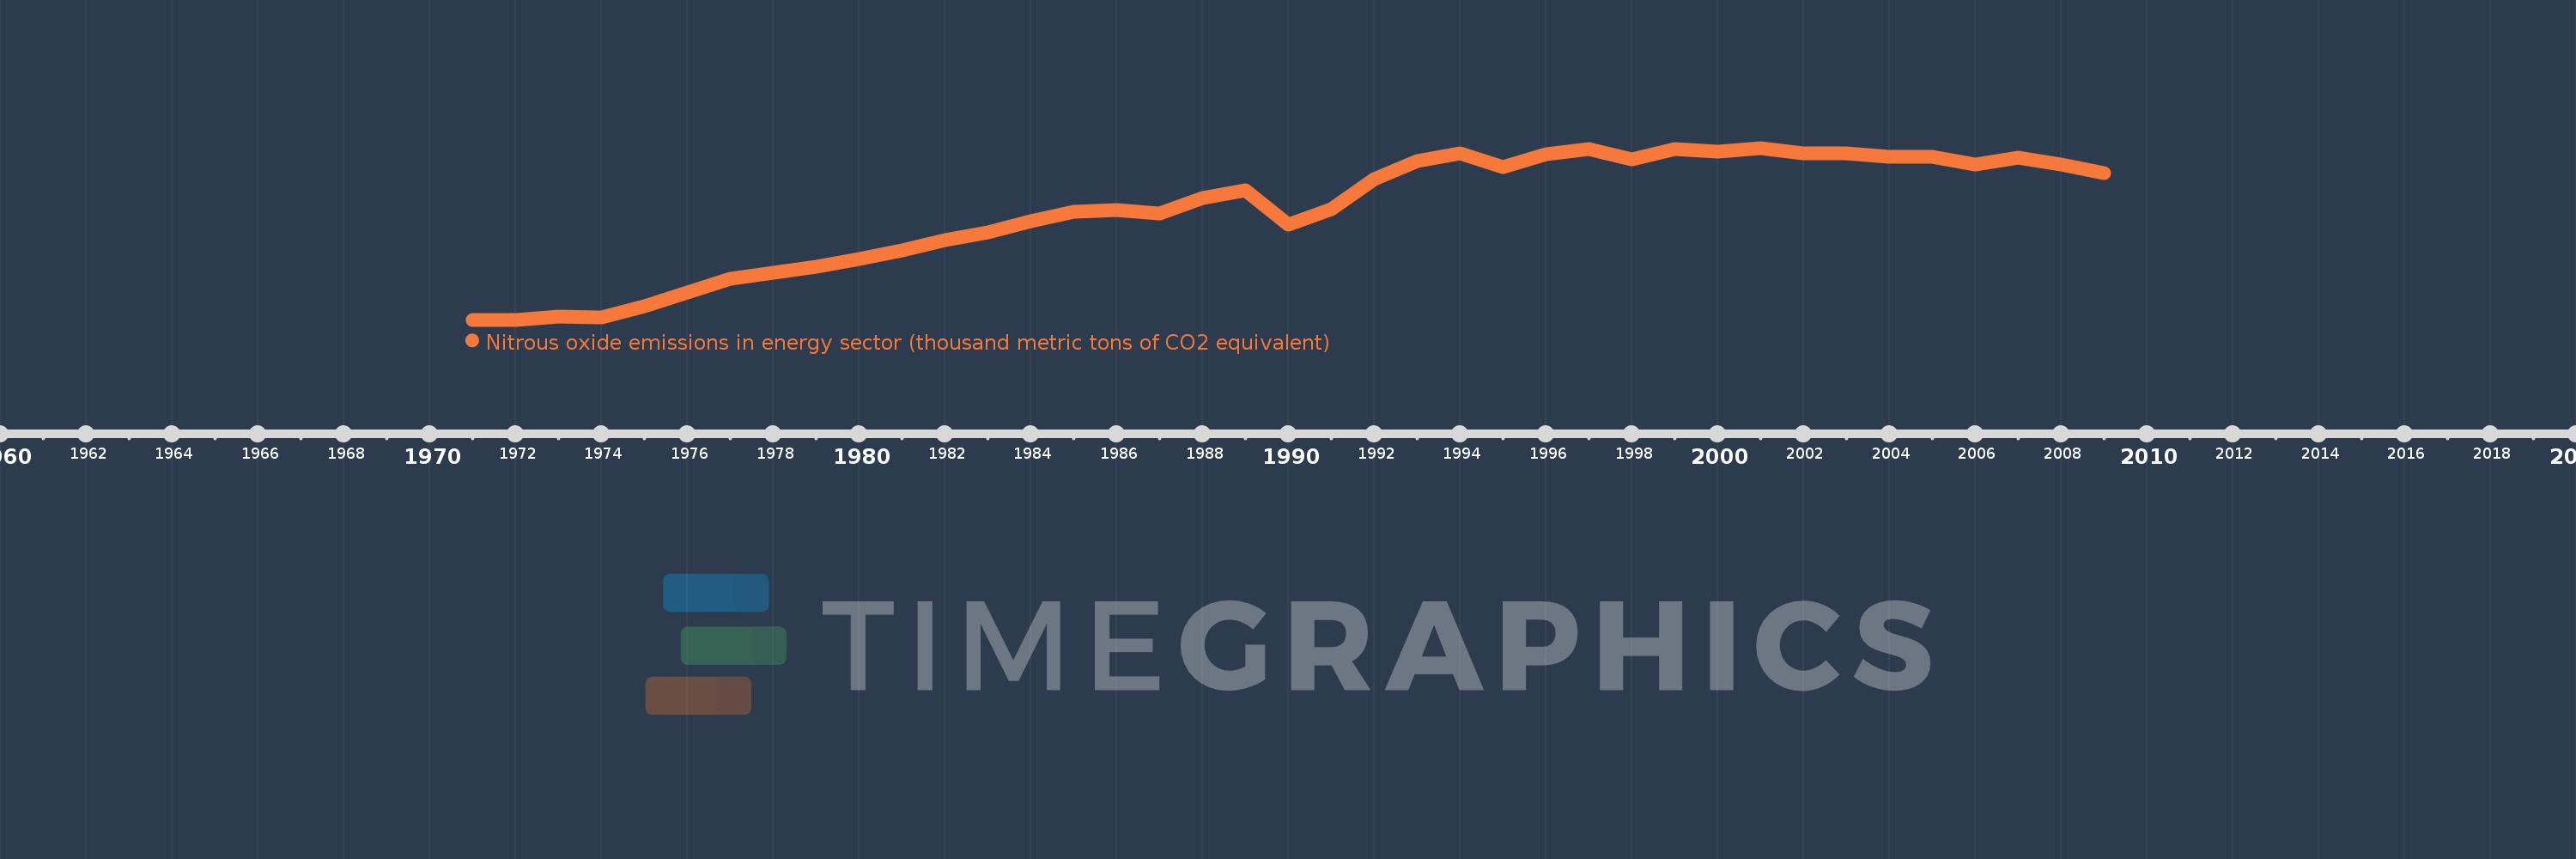
Nitrous oxide emissions in energy sector (thousand metric tons of CO2 equivalent)
2009,2008,2007,2006,2005,2004,2003,2002,2001,2000,1999,1998,1997,1996,1995,1994,1993,1992,1991,1990,1989,1988,1987,1986,1985,1984,1983,1982,1981,1980,1979,1978,1977,1976,1975,1974,1973,1972,1971
This statistics in other country:
AfghanistanAlbaniaAlgeriaAmerican SamoaAndorraAngolaAntigua and BarbudaArab WorldArgentinaArmeniaArubaAustraliaAustriaAzerbaijanBahamas, TheBahrainBangladeshBarbadosBelarusBelgiumBelizeBeninBermudaBhutanBoliviaBosnia and HerzegovinaBotswanaBrazilBritish Virgin IslandsBrunei DarussalamBulgariaBurkina FasoBurundiCabo VerdeCambodiaCameroonCanadaCaribbean small statesCayman IslandsCentral African RepublicCentral Europe and the BalticsChadChannel IslandsChileChinaColombiaComorosCongo, Dem. Rep.Congo, Rep.Costa RicaCote d'IvoireCroatiaCubaCuracaoCyprusCzech RepublicDenmarkDjiboutiDominicaDominican RepublicEarly-demographic dividendEast Asia & PacificEast Asia & Pacific (excluding high income)East Asia & Pacific (IDA & IBRD countries)EcuadorEgypt, Arab Rep.El SalvadorEquatorial GuineaEritreaEstoniaEthiopiaEuro areaEurope & Central AsiaEurope & Central Asia (excluding high income)Europe & Central Asia (IDA & IBRD countries)European UnionFaroe IslandsFijiFinlandFragile and conflict affected situationsFranceFrench PolynesiaGabonGambia, TheGeorgiaGermanyGhanaGibraltarGreeceGreenlandGrenadaGuamGuatemalaGuineaGuinea-BissauGuyanaHaitiHeavily indebted poor countries (HIPC)High incomeHondurasHong Kong SAR, ChinaHungaryIBRD onlyIcelandIDA & IBRD totalIDA blendIDA onlyIDA totalIndiaIndonesiaIran, Islamic Rep.IraqIrelandIsle of ManIsraelItalyJamaicaJapanJordanKazakhstanKenyaKiribatiKorea, Dem. People’s Rep.Korea, Rep.KosovoKuwaitKyrgyz RepublicLao PDRLate-demographic dividendLatin America & Caribbean Latin America & Caribbean (excluding high income)Latin America & the Caribbean (IDA & IBRD countries)LatviaLeast developed countries: UN classificationLebanonLesothoLiberiaLibyaLiechtensteinLithuaniaLow & middle incomeLow incomeLower middle incomeLuxembourgMacao SAR, ChinaMacedonia, FYRMadagascarMalawiMalaysiaMaldivesMaliMaltaMarshall IslandsMauritaniaMauritiusMexicoMicronesia, Fed. Sts.Middle East & North AfricaMiddle East & North Africa (excluding high income)Middle East & North Africa (IDA & IBRD countries)Middle incomeMoldovaMonacoMongoliaMontenegroMoroccoMozambiqueMyanmarNamibiaNauruNepalNetherlandsNew CaledoniaNew ZealandNicaraguaNigerNigeriaNorth AmericaNorthern Mariana IslandsNorwayOECD membersOmanOther small statesPacific island small statesPakistanPalauPanamaPapua New GuineaParaguayPeruPhilippinesPolandPortugalPost-demographic dividendPre-demographic dividendPuerto RicoQatarRomaniaRussian FederationRwandaSamoaSan MarinoSao Tome and PrincipeSaudi ArabiaSenegalSerbiaSeychellesSierra LeoneSingaporeSint Maarten (Dutch part)Slovak RepublicSloveniaSmall statesSolomon IslandsSomaliaSouth AfricaSouth AsiaSouth Asia (IDA & IBRD)South SudanSpainSri LankaSt. Kitts and NevisSt. LuciaSt. Martin (French part)St. Vincent and the GrenadinesSub-Saharan Africa Sub-Saharan Africa (excluding high income)Sub-Saharan Africa (IDA & IBRD countries)SudanSurinameSwazilandSwedenSwitzerlandSyrian Arab RepublicTajikistanTanzaniaThailandTimor-LesteTogoTongaTrinidad and TobagoTunisiaTurkeyTurkmenistanTurks and Caicos IslandsTuvaluUgandaUkraineUnited Arab EmiratesUnited KingdomUnited StatesUpper middle incomeUruguayUzbekistanVanuatuVenezuela, RBVietnamVirgin Islands (U.S.)West Bank and GazaWorldYemen, Rep.ZambiaZimbabwe Timeline:
This timeline shows a graph from 1971 to 2009 of Syrian Arab Republic. No data until 1970. Number of actual observations by date: 39.
Source name:
World Development Indicators
Source organization:
European Commission, Joint Research Centre (JRC)/Netherlands Environmental Assessment Agency (PBL). Emission Database for Global Atmospheric Research (EDGAR): http://edgar.jrc.ec.europa.eu/
Categories, topics:
Energy & Mining, Environment
Last updated:
apr 23, 2017
Indicators value changes by year
Minimum:
69.297
jan 1, 1972
Maximum:
283.334
jan 1, 2001
At the date of observation
Value
Absolute change
Change from previous value
jan 1, 1971
69.387
+69.387
0.0%
jan 1, 1972
69.297
-0.09
-0.13%
jan 1, 1973
73.473
+4.176
6.03%
jan 1, 1974
72.52
-0.953
-1.3%
jan 1, 1975
86.621
+14.101
19.44%
jan 1, 1976
102.964
+16.343
18.87%
jan 1, 1977
120.685
+17.721
17.21%
jan 1, 1978
127.808
+7.123
5.9%
jan 1, 1979
134.833
+7.025
5.5%
jan 1, 1980
144.995
+10.162
7.54%
jan 1, 1981
155.208
+10.213
7.04%
jan 1, 1982
168.474
+13.267
8.55%
jan 1, 1983
177.86
+9.386
5.57%
jan 1, 1984
192.349
+14.488
8.15%
jan 1, 1985
203.977
+11.628
6.05%
jan 1, 1986
205.442
+1.465
0.72%
jan 1, 1987
201.628
-3.814
-1.86%
jan 1, 1988
221.083
+19.455
9.65%
jan 1, 1989
231.004
+9.921
4.49%
jan 1, 1990
188.018
-42.986
-18.61%
jan 1, 1991
207.143
+19.125
10.17%
jan 1, 1992
244.523
+37.38
18.05%
jan 1, 1993
267.062
+22.539
9.22%
jan 1, 1994
277.091
+10.028
3.76%
jan 1, 1995
259.851
-17.24
-6.22%
jan 1, 1996
275.864
+16.014
6.16%
jan 1, 1997
281.558
+5.693
2.06%
jan 1, 1998
268.624
-12.933
-4.59%
jan 1, 1999
282.367
+13.743
5.12%
jan 1, 2000
278.21
-4.157
-1.47%
jan 1, 2001
283.334
+5.125
1.84%
jan 1, 2002
276.379
-6.955
-2.45%
jan 1, 2003
276.129
-0.25
-0.09%
jan 1, 2004
272.544
-3.585
-1.3%
jan 1, 2005
272.346
-0.198
-0.07%
jan 1, 2006
262.24
-10.106
-3.71%
jan 1, 2007
270.927
+8.687
3.31%
jan 1, 2008
262.865
-8.062
-2.98%
jan 1, 2009
251.716
-11.149
-4.24%
Ranking of countries by current statistics by years


Comments: