29
/
en
AIzaSyAYiBZKx7MnpbEhh9jyipgxe19OcubqV5w
April 1, 2024
252242
St. Vincent and the Grenadines
VCT
true
2
1
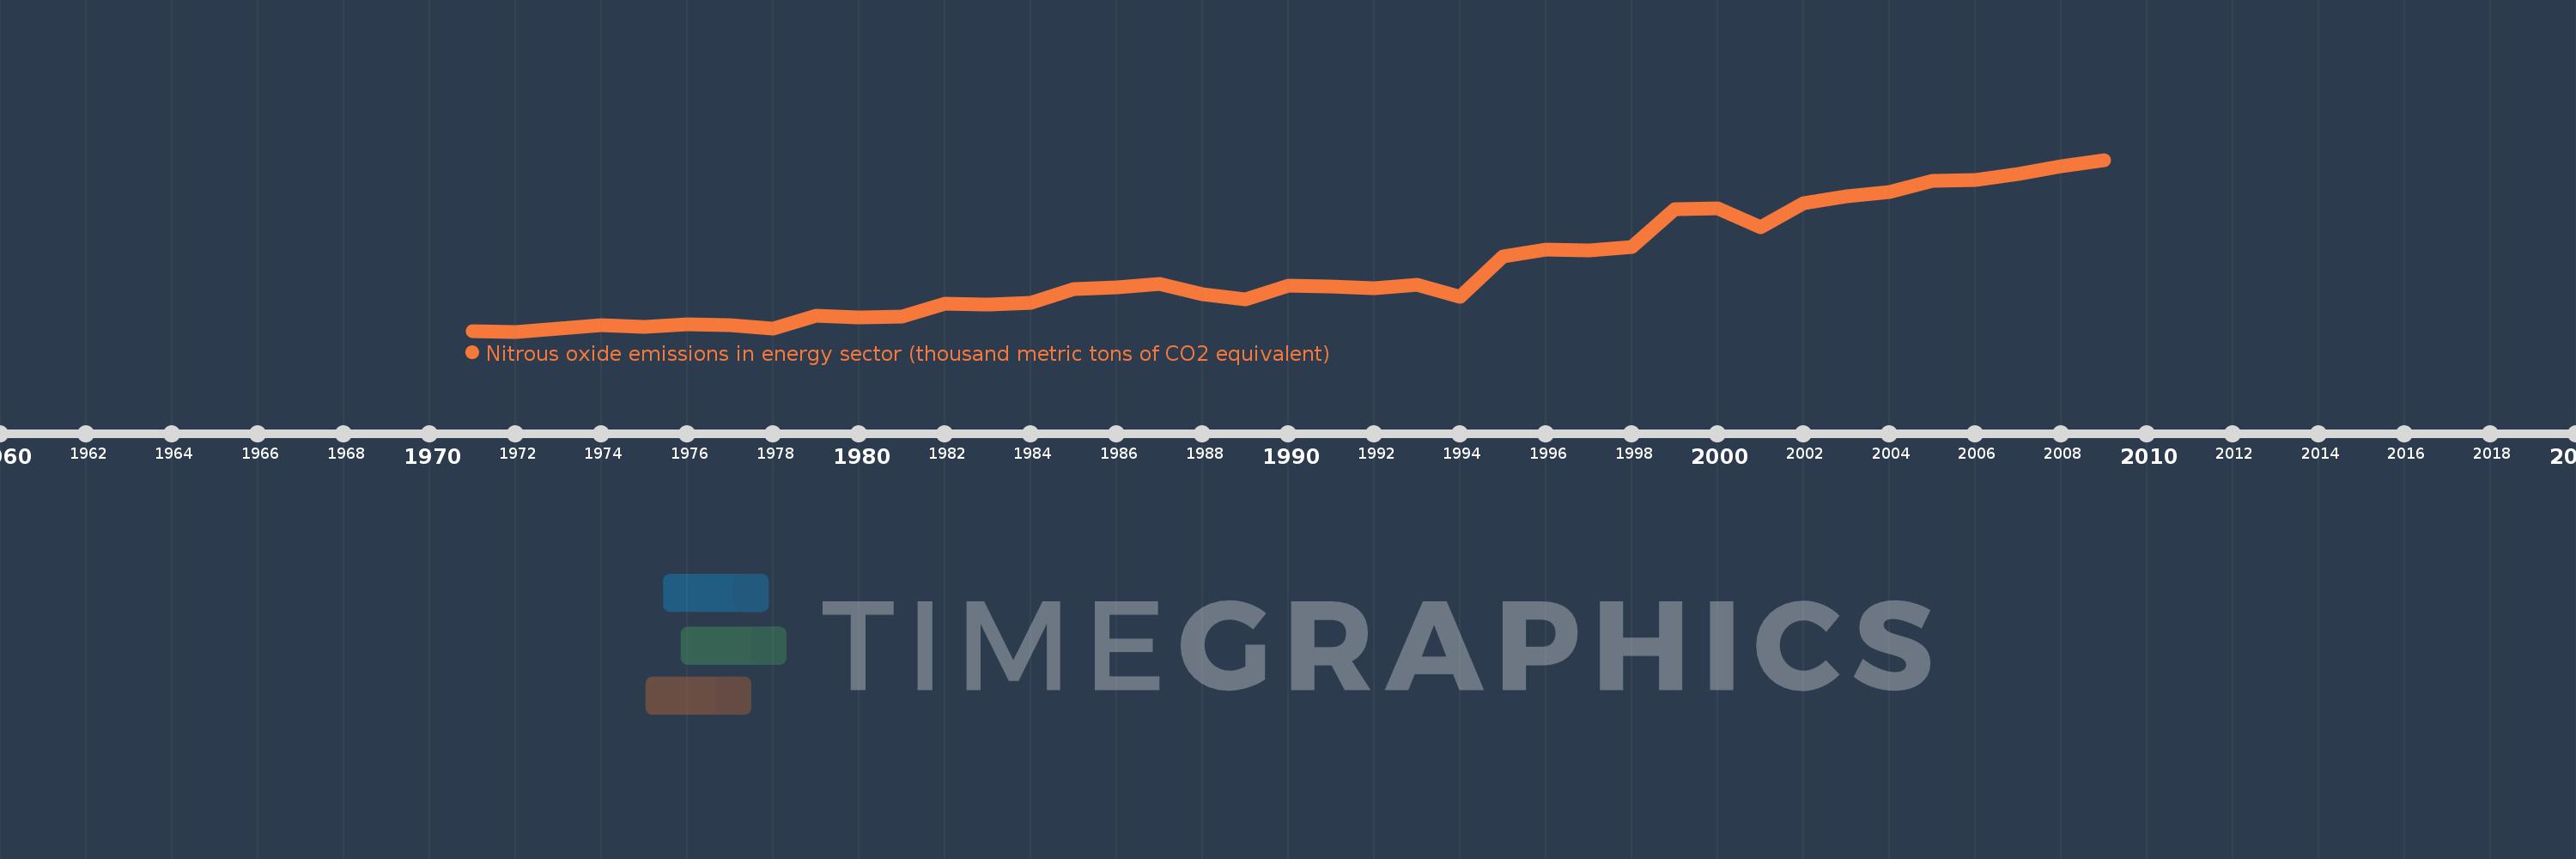
Nitrous oxide emissions in energy sector (thousand metric tons of CO2 equivalent)
2009,2008,2007,2006,2005,2004,2003,2002,2001,2000,1999,1998,1997,1996,1995,1994,1993,1992,1991,1990,1989,1988,1987,1986,1985,1984,1983,1982,1981,1980,1979,1978,1977,1976,1975,1974,1973,1972,1971
This statistics in other country:
AfghanistanAlbaniaAlgeriaAmerican SamoaAndorraAngolaAntigua and BarbudaArab WorldArgentinaArmeniaArubaAustraliaAustriaAzerbaijanBahamas, TheBahrainBangladeshBarbadosBelarusBelgiumBelizeBeninBermudaBhutanBoliviaBosnia and HerzegovinaBotswanaBrazilBritish Virgin IslandsBrunei DarussalamBulgariaBurkina FasoBurundiCabo VerdeCambodiaCameroonCanadaCaribbean small statesCayman IslandsCentral African RepublicCentral Europe and the BalticsChadChannel IslandsChileChinaColombiaComorosCongo, Dem. Rep.Congo, Rep.Costa RicaCote d'IvoireCroatiaCubaCuracaoCyprusCzech RepublicDenmarkDjiboutiDominicaDominican RepublicEarly-demographic dividendEast Asia & PacificEast Asia & Pacific (excluding high income)East Asia & Pacific (IDA & IBRD countries)EcuadorEgypt, Arab Rep.El SalvadorEquatorial GuineaEritreaEstoniaEthiopiaEuro areaEurope & Central AsiaEurope & Central Asia (excluding high income)Europe & Central Asia (IDA & IBRD countries)European UnionFaroe IslandsFijiFinlandFragile and conflict affected situationsFranceFrench PolynesiaGabonGambia, TheGeorgiaGermanyGhanaGibraltarGreeceGreenlandGrenadaGuamGuatemalaGuineaGuinea-BissauGuyanaHaitiHeavily indebted poor countries (HIPC)High incomeHondurasHong Kong SAR, ChinaHungaryIBRD onlyIcelandIDA & IBRD totalIDA blendIDA onlyIDA totalIndiaIndonesiaIran, Islamic Rep.IraqIrelandIsle of ManIsraelItalyJamaicaJapanJordanKazakhstanKenyaKiribatiKorea, Dem. People’s Rep.Korea, Rep.KosovoKuwaitKyrgyz RepublicLao PDRLate-demographic dividendLatin America & Caribbean Latin America & Caribbean (excluding high income)Latin America & the Caribbean (IDA & IBRD countries)LatviaLeast developed countries: UN classificationLebanonLesothoLiberiaLibyaLiechtensteinLithuaniaLow & middle incomeLow incomeLower middle incomeLuxembourgMacao SAR, ChinaMacedonia, FYRMadagascarMalawiMalaysiaMaldivesMaliMaltaMarshall IslandsMauritaniaMauritiusMexicoMicronesia, Fed. Sts.Middle East & North AfricaMiddle East & North Africa (excluding high income)Middle East & North Africa (IDA & IBRD countries)Middle incomeMoldovaMonacoMongoliaMontenegroMoroccoMozambiqueMyanmarNamibiaNauruNepalNetherlandsNew CaledoniaNew ZealandNicaraguaNigerNigeriaNorth AmericaNorthern Mariana IslandsNorwayOECD membersOmanOther small statesPacific island small statesPakistanPalauPanamaPapua New GuineaParaguayPeruPhilippinesPolandPortugalPost-demographic dividendPre-demographic dividendPuerto RicoQatarRomaniaRussian FederationRwandaSamoaSan MarinoSao Tome and PrincipeSaudi ArabiaSenegalSerbiaSeychellesSierra LeoneSingaporeSint Maarten (Dutch part)Slovak RepublicSloveniaSmall statesSolomon IslandsSomaliaSouth AfricaSouth AsiaSouth Asia (IDA & IBRD)South SudanSpainSri LankaSt. Kitts and NevisSt. LuciaSt. Martin (French part)St. Vincent and the GrenadinesSub-Saharan Africa Sub-Saharan Africa (excluding high income)Sub-Saharan Africa (IDA & IBRD countries)SudanSurinameSwazilandSwedenSwitzerlandSyrian Arab RepublicTajikistanTanzaniaThailandTimor-LesteTogoTongaTrinidad and TobagoTunisiaTurkeyTurkmenistanTurks and Caicos IslandsTuvaluUgandaUkraineUnited Arab EmiratesUnited KingdomUnited StatesUpper middle incomeUruguayUzbekistanVanuatuVenezuela, RBVietnamVirgin Islands (U.S.)West Bank and GazaWorldYemen, Rep.ZambiaZimbabwe Timeline:
This timeline shows a graph from 1971 to 2009 of St. Vincent and the Grenadines. No data until 1970. Number of actual observations by date: 39.
Source name:
World Development Indicators
Source organization:
European Commission, Joint Research Centre (JRC)/Netherlands Environmental Assessment Agency (PBL). Emission Database for Global Atmospheric Research (EDGAR): http://edgar.jrc.ec.europa.eu/
Categories, topics:
Energy & Mining, Environment
Last updated:
apr 23, 2017
Indicators value changes by year
At the date of observation
Value
Absolute change
Change from previous value
jan 1, 1971
0.781
+0.781
0.0%
jan 1, 1972
0.778
-0.003
-0.36%
jan 1, 1973
0.8
+0.021
2.72%
jan 1, 1974
0.833
+0.034
4.19%
jan 1, 1975
0.815
-0.018
-2.17%
jan 1, 1976
0.836
+0.021
2.61%
jan 1, 1977
0.833
-0.003
-0.38%
jan 1, 1978
0.802
-0.031
-3.7%
jan 1, 1979
0.908
+0.106
13.22%
jan 1, 1980
0.896
-0.012
-1.34%
jan 1, 1981
0.904
+0.008
0.85%
jan 1, 1982
1.01
+0.107
11.79%
jan 1, 1983
1.004
-0.007
-0.67%
jan 1, 1984
1.018
+0.014
1.38%
jan 1, 1985
1.131
+0.113
11.12%
jan 1, 1986
1.145
+0.014
1.23%
jan 1, 1987
1.174
+0.03
2.61%
jan 1, 1988
1.084
-0.09
-7.67%
jan 1, 1989
1.041
-0.043
-3.96%
jan 1, 1990
1.16
+0.119
11.41%
jan 1, 1991
1.151
-0.009
-0.76%
jan 1, 1992
1.133
-0.019
-1.65%
jan 1, 1993
1.164
+0.032
2.82%
jan 1, 1994
1.068
-0.097
-8.32%
jan 1, 1995
1.395
+0.327
30.64%
jan 1, 1996
1.452
+0.057
4.12%
jan 1, 1997
1.444
-0.008
-0.58%
jan 1, 1998
1.478
+0.034
2.36%
jan 1, 1999
1.784
+0.307
20.76%
jan 1, 2000
1.794
+0.01
0.54%
jan 1, 2001
1.637
-0.157
-8.76%
jan 1, 2002
1.833
+0.196
11.98%
jan 1, 2003
1.889
+0.056
3.03%
jan 1, 2004
1.931
+0.042
2.24%
jan 1, 2005
2.022
+0.091
4.73%
jan 1, 2006
2.027
+0.004
0.21%
jan 1, 2007
2.076
+0.05
2.46%
jan 1, 2008
2.139
+0.062
3.0%
jan 1, 2009
2.193
+0.054
2.53%
Ranking of countries by current statistics by years


Comments: