29
/
en
AIzaSyAYiBZKx7MnpbEhh9jyipgxe19OcubqV5w
April 1, 2024
129712
Estonia
EST
true
2
1
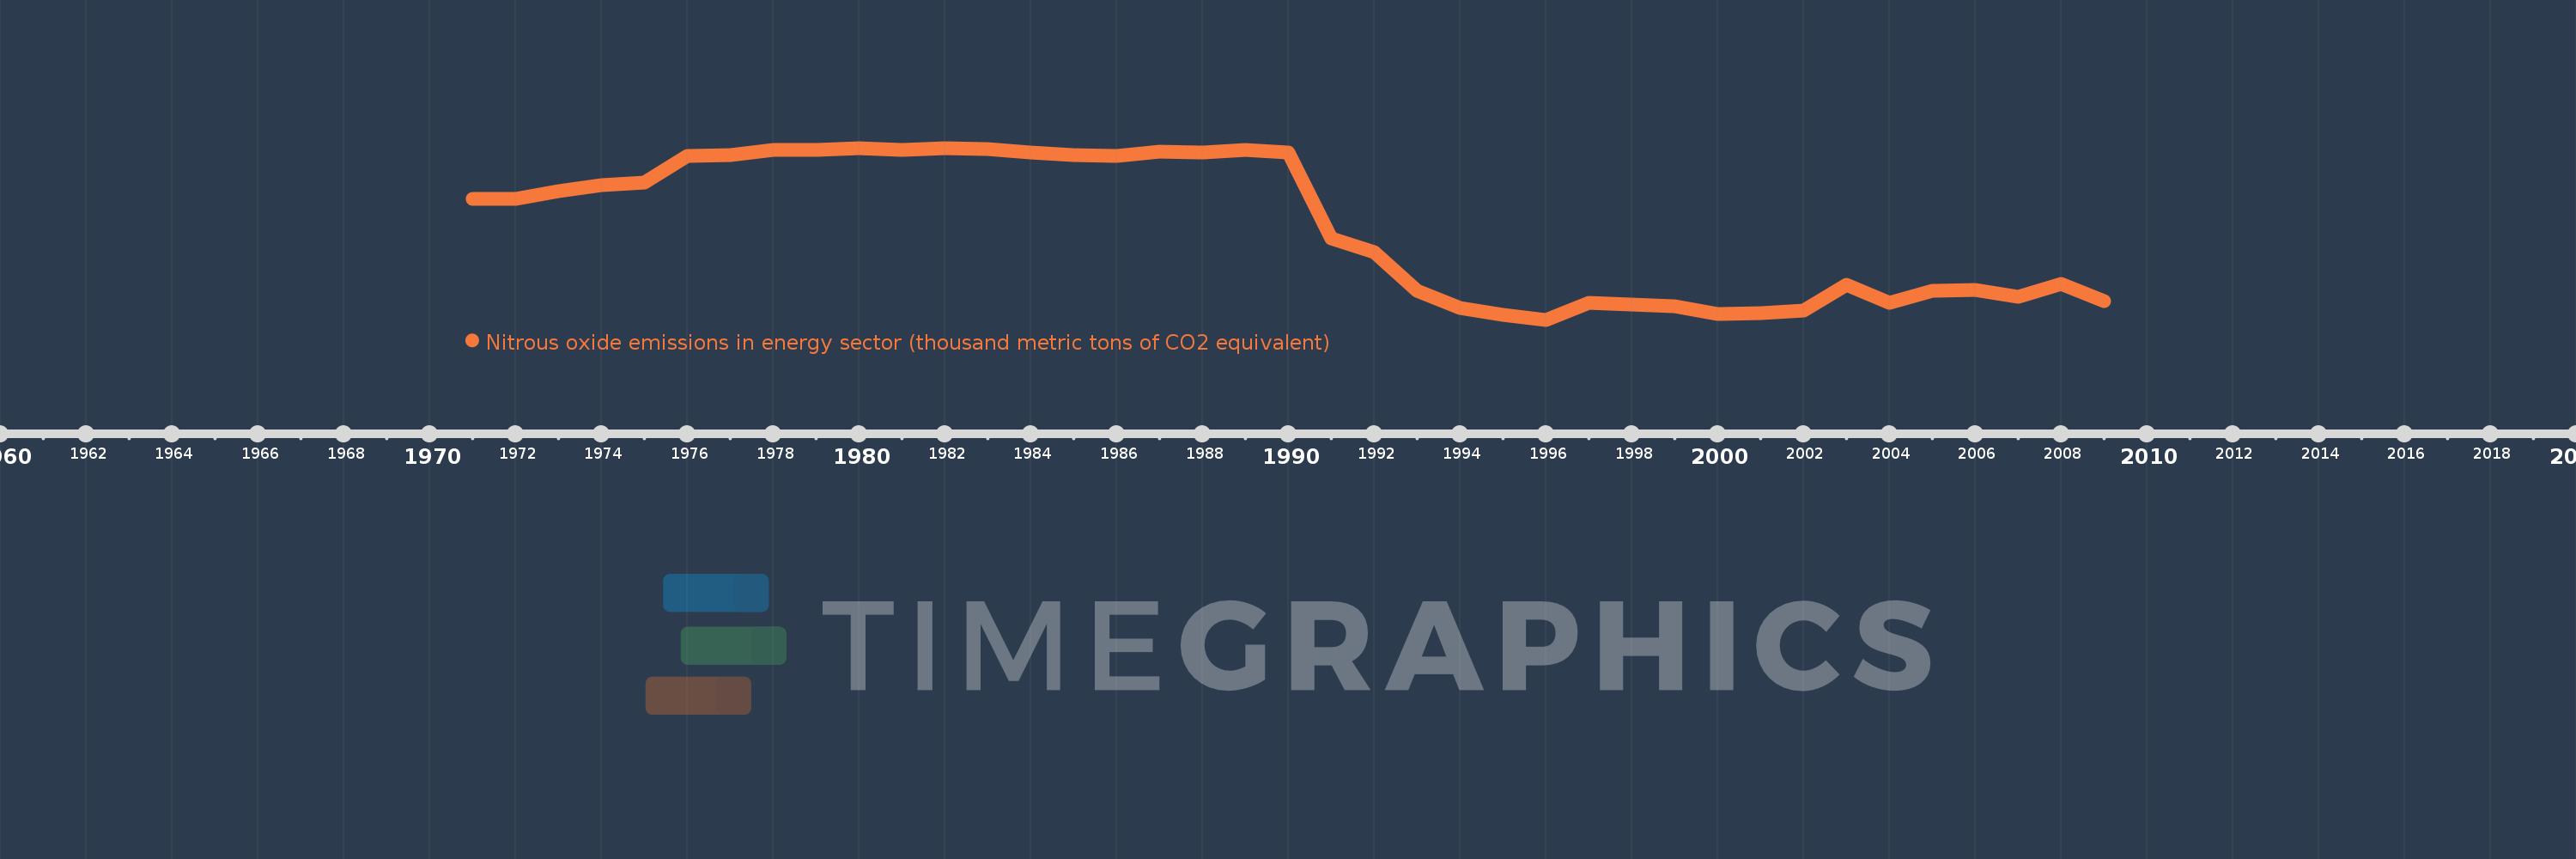
Nitrous oxide emissions in energy sector (thousand metric tons of CO2 equivalent)
2009,2008,2007,2006,2005,2004,2003,2002,2001,2000,1999,1998,1997,1996,1995,1994,1993,1992,1991,1990,1989,1988,1987,1986,1985,1984,1983,1982,1981,1980,1979,1978,1977,1976,1975,1974,1973,1972,1971
This statistics in other country:
AfghanistanAlbaniaAlgeriaAmerican SamoaAndorraAngolaAntigua and BarbudaArab WorldArgentinaArmeniaArubaAustraliaAustriaAzerbaijanBahamas, TheBahrainBangladeshBarbadosBelarusBelgiumBelizeBeninBermudaBhutanBoliviaBosnia and HerzegovinaBotswanaBrazilBritish Virgin IslandsBrunei DarussalamBulgariaBurkina FasoBurundiCabo VerdeCambodiaCameroonCanadaCaribbean small statesCayman IslandsCentral African RepublicCentral Europe and the BalticsChadChannel IslandsChileChinaColombiaComorosCongo, Dem. Rep.Congo, Rep.Costa RicaCote d'IvoireCroatiaCubaCuracaoCyprusCzech RepublicDenmarkDjiboutiDominicaDominican RepublicEarly-demographic dividendEast Asia & PacificEast Asia & Pacific (excluding high income)East Asia & Pacific (IDA & IBRD countries)EcuadorEgypt, Arab Rep.El SalvadorEquatorial GuineaEritreaEstoniaEthiopiaEuro areaEurope & Central AsiaEurope & Central Asia (excluding high income)Europe & Central Asia (IDA & IBRD countries)European UnionFaroe IslandsFijiFinlandFragile and conflict affected situationsFranceFrench PolynesiaGabonGambia, TheGeorgiaGermanyGhanaGibraltarGreeceGreenlandGrenadaGuamGuatemalaGuineaGuinea-BissauGuyanaHaitiHeavily indebted poor countries (HIPC)High incomeHondurasHong Kong SAR, ChinaHungaryIBRD onlyIcelandIDA & IBRD totalIDA blendIDA onlyIDA totalIndiaIndonesiaIran, Islamic Rep.IraqIrelandIsle of ManIsraelItalyJamaicaJapanJordanKazakhstanKenyaKiribatiKorea, Dem. People’s Rep.Korea, Rep.KosovoKuwaitKyrgyz RepublicLao PDRLate-demographic dividendLatin America & Caribbean Latin America & Caribbean (excluding high income)Latin America & the Caribbean (IDA & IBRD countries)LatviaLeast developed countries: UN classificationLebanonLesothoLiberiaLibyaLiechtensteinLithuaniaLow & middle incomeLow incomeLower middle incomeLuxembourgMacao SAR, ChinaMacedonia, FYRMadagascarMalawiMalaysiaMaldivesMaliMaltaMarshall IslandsMauritaniaMauritiusMexicoMicronesia, Fed. Sts.Middle East & North AfricaMiddle East & North Africa (excluding high income)Middle East & North Africa (IDA & IBRD countries)Middle incomeMoldovaMonacoMongoliaMontenegroMoroccoMozambiqueMyanmarNamibiaNauruNepalNetherlandsNew CaledoniaNew ZealandNicaraguaNigerNigeriaNorth AmericaNorthern Mariana IslandsNorwayOECD membersOmanOther small statesPacific island small statesPakistanPalauPanamaPapua New GuineaParaguayPeruPhilippinesPolandPortugalPost-demographic dividendPre-demographic dividendPuerto RicoQatarRomaniaRussian FederationRwandaSamoaSan MarinoSao Tome and PrincipeSaudi ArabiaSenegalSerbiaSeychellesSierra LeoneSingaporeSint Maarten (Dutch part)Slovak RepublicSloveniaSmall statesSolomon IslandsSomaliaSouth AfricaSouth AsiaSouth Asia (IDA & IBRD)South SudanSpainSri LankaSt. Kitts and NevisSt. LuciaSt. Martin (French part)St. Vincent and the GrenadinesSub-Saharan Africa Sub-Saharan Africa (excluding high income)Sub-Saharan Africa (IDA & IBRD countries)SudanSurinameSwazilandSwedenSwitzerlandSyrian Arab RepublicTajikistanTanzaniaThailandTimor-LesteTogoTongaTrinidad and TobagoTunisiaTurkeyTurkmenistanTurks and Caicos IslandsTuvaluUgandaUkraineUnited Arab EmiratesUnited KingdomUnited StatesUpper middle incomeUruguayUzbekistanVanuatuVenezuela, RBVietnamVirgin Islands (U.S.)West Bank and GazaWorldYemen, Rep.ZambiaZimbabwe Timeline:
This timeline shows a graph from 1971 to 2009 of Estonia. No data until 1970. Number of actual observations by date: 39.
Source name:
World Development Indicators
Source organization:
European Commission, Joint Research Centre (JRC)/Netherlands Environmental Assessment Agency (PBL). Emission Database for Global Atmospheric Research (EDGAR): http://edgar.jrc.ec.europa.eu/
Categories, topics:
Energy & Mining, Environment
Last updated:
apr 23, 2017
Indicators value changes by year
Minimum:
107.347
jan 1, 1996
Maximum:
326.786
jan 1, 1980
At the date of observation
Value
Absolute change
Change from previous value
jan 1, 1971
261.641
+261.641
0.0%
jan 1, 1972
261.641
+0.0
0.0%
jan 1, 1973
272.084
+10.443
3.99%
jan 1, 1974
278.925
+6.841
2.51%
jan 1, 1975
282.952
+4.027
1.44%
jan 1, 1976
316.938
+33.986
12.01%
jan 1, 1977
317.518
+0.58
0.18%
jan 1, 1978
324.435
+6.917
2.18%
jan 1, 1979
323.714
-0.721
-0.22%
jan 1, 1980
326.786
+3.071
0.95%
jan 1, 1981
324.774
-2.012
-0.62%
jan 1, 1982
326.437
+1.663
0.51%
jan 1, 1983
324.994
-1.443
-0.44%
jan 1, 1984
321.291
-3.702
-1.14%
jan 1, 1985
317.438
-3.853
-1.2%
jan 1, 1986
316.73
-0.708
-0.22%
jan 1, 1987
321.872
+5.142
1.62%
jan 1, 1988
321.306
-0.566
-0.18%
jan 1, 1989
324.097
+2.791
0.87%
jan 1, 1990
320.467
-3.63
-1.12%
jan 1, 1991
211.39
-109.076
-34.04%
jan 1, 1992
193.156
-18.234
-8.63%
jan 1, 1993
144.714
-48.442
-25.08%
jan 1, 1994
122.365
-22.349
-15.44%
jan 1, 1995
113.531
-8.834
-7.22%
jan 1, 1996
107.347
-6.184
-5.45%
jan 1, 1997
128.906
+21.558
20.08%
jan 1, 1998
126.291
-2.615
-2.03%
jan 1, 1999
124.539
-1.751
-1.39%
jan 1, 2000
114.628
-9.911
-7.96%
jan 1, 2001
116.279
+1.651
1.44%
jan 1, 2002
119.397
+3.118
2.68%
jan 1, 2003
152.19
+32.793
27.47%
jan 1, 2004
129.26
-22.93
-15.07%
jan 1, 2005
144.741
+15.481
11.98%
jan 1, 2006
145.492
+0.751
0.52%
jan 1, 2007
136.408
-9.084
-6.24%
jan 1, 2008
153.092
+16.684
12.23%
jan 1, 2009
131.215
-21.877
-14.29%
Ranking of countries by current statistics by years


Comments: