29
/
en
AIzaSyAYiBZKx7MnpbEhh9jyipgxe19OcubqV5w
April 1, 2024
56501
Small states
SST
false
2
1
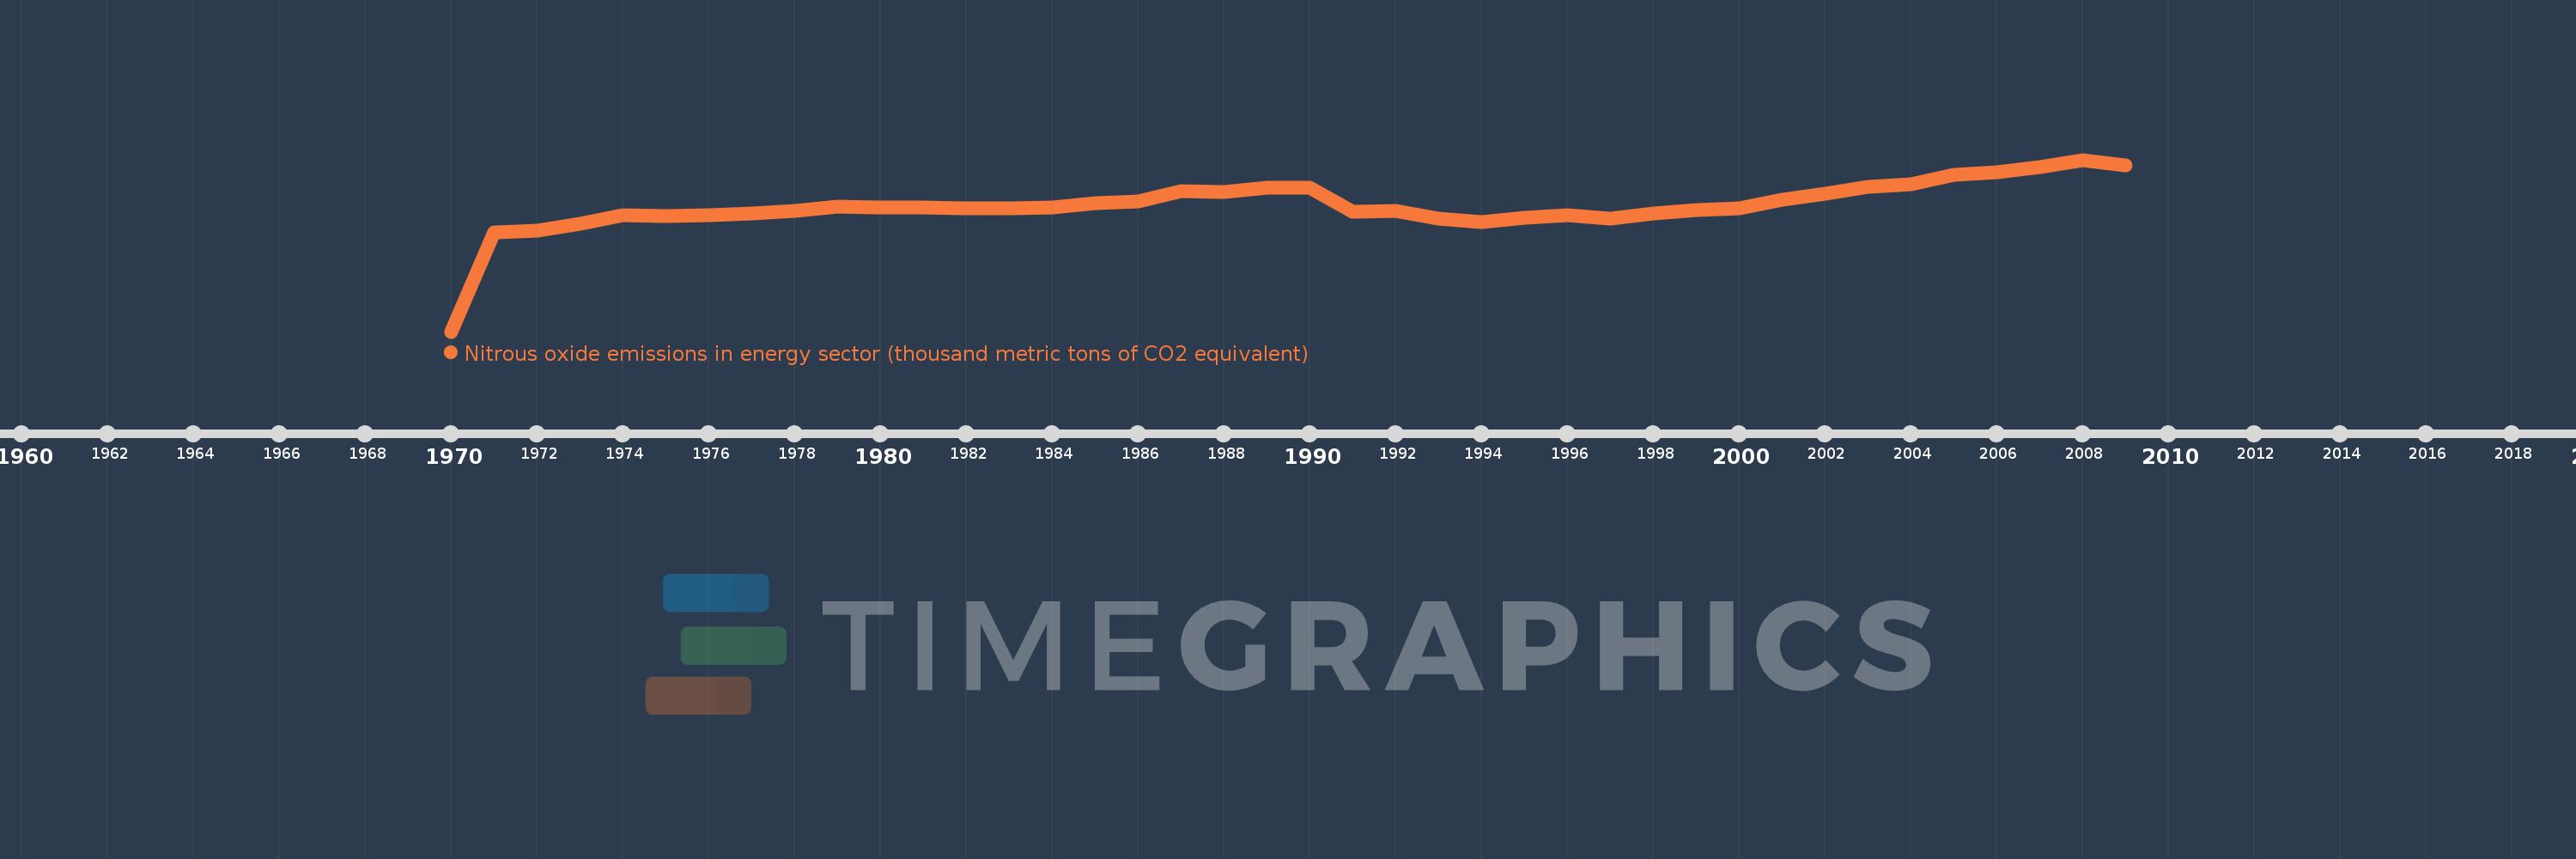
Nitrous oxide emissions in energy sector (thousand metric tons of CO2 equivalent)
2009,2008,2007,2006,2005,2004,2003,2002,2001,2000,1999,1998,1997,1996,1995,1994,1993,1992,1991,1990,1989,1988,1987,1986,1985,1984,1983,1982,1981,1980,1979,1978,1977,1976,1975,1974,1973,1972,1971,1970
This statistics in other country:
AfghanistanAlbaniaAlgeriaAmerican SamoaAndorraAngolaAntigua and BarbudaArab WorldArgentinaArmeniaArubaAustraliaAustriaAzerbaijanBahamas, TheBahrainBangladeshBarbadosBelarusBelgiumBelizeBeninBermudaBhutanBoliviaBosnia and HerzegovinaBotswanaBrazilBritish Virgin IslandsBrunei DarussalamBulgariaBurkina FasoBurundiCabo VerdeCambodiaCameroonCanadaCaribbean small statesCayman IslandsCentral African RepublicCentral Europe and the BalticsChadChannel IslandsChileChinaColombiaComorosCongo, Dem. Rep.Congo, Rep.Costa RicaCote d'IvoireCroatiaCubaCuracaoCyprusCzech RepublicDenmarkDjiboutiDominicaDominican RepublicEarly-demographic dividendEast Asia & PacificEast Asia & Pacific (excluding high income)East Asia & Pacific (IDA & IBRD countries)EcuadorEgypt, Arab Rep.El SalvadorEquatorial GuineaEritreaEstoniaEthiopiaEuro areaEurope & Central AsiaEurope & Central Asia (excluding high income)Europe & Central Asia (IDA & IBRD countries)European UnionFaroe IslandsFijiFinlandFragile and conflict affected situationsFranceFrench PolynesiaGabonGambia, TheGeorgiaGermanyGhanaGibraltarGreeceGreenlandGrenadaGuamGuatemalaGuineaGuinea-BissauGuyanaHaitiHeavily indebted poor countries (HIPC)High incomeHondurasHong Kong SAR, ChinaHungaryIBRD onlyIcelandIDA & IBRD totalIDA blendIDA onlyIDA totalIndiaIndonesiaIran, Islamic Rep.IraqIrelandIsle of ManIsraelItalyJamaicaJapanJordanKazakhstanKenyaKiribatiKorea, Dem. People’s Rep.Korea, Rep.KosovoKuwaitKyrgyz RepublicLao PDRLate-demographic dividendLatin America & Caribbean Latin America & Caribbean (excluding high income)Latin America & the Caribbean (IDA & IBRD countries)LatviaLeast developed countries: UN classificationLebanonLesothoLiberiaLibyaLiechtensteinLithuaniaLow & middle incomeLow incomeLower middle incomeLuxembourgMacao SAR, ChinaMacedonia, FYRMadagascarMalawiMalaysiaMaldivesMaliMaltaMarshall IslandsMauritaniaMauritiusMexicoMicronesia, Fed. Sts.Middle East & North AfricaMiddle East & North Africa (excluding high income)Middle East & North Africa (IDA & IBRD countries)Middle incomeMoldovaMonacoMongoliaMontenegroMoroccoMozambiqueMyanmarNamibiaNauruNepalNetherlandsNew CaledoniaNew ZealandNicaraguaNigerNigeriaNorth AmericaNorthern Mariana IslandsNorwayOECD membersOmanOther small statesPacific island small statesPakistanPalauPanamaPapua New GuineaParaguayPeruPhilippinesPolandPortugalPost-demographic dividendPre-demographic dividendPuerto RicoQatarRomaniaRussian FederationRwandaSamoaSan MarinoSao Tome and PrincipeSaudi ArabiaSenegalSerbiaSeychellesSierra LeoneSingaporeSint Maarten (Dutch part)Slovak RepublicSloveniaSmall statesSolomon IslandsSomaliaSouth AfricaSouth AsiaSouth Asia (IDA & IBRD)South SudanSpainSri LankaSt. Kitts and NevisSt. LuciaSt. Martin (French part)St. Vincent and the GrenadinesSub-Saharan Africa Sub-Saharan Africa (excluding high income)Sub-Saharan Africa (IDA & IBRD countries)SudanSurinameSwazilandSwedenSwitzerlandSyrian Arab RepublicTajikistanTanzaniaThailandTimor-LesteTogoTongaTrinidad and TobagoTunisiaTurkeyTurkmenistanTurks and Caicos IslandsTuvaluUgandaUkraineUnited Arab EmiratesUnited KingdomUnited StatesUpper middle incomeUruguayUzbekistanVanuatuVenezuela, RBVietnamVirgin Islands (U.S.)West Bank and GazaWorldYemen, Rep.ZambiaZimbabwe Timeline:
This timeline shows a graph from 1970 to 2009 of Small states. No data until 1969. Number of actual observations by date: 40.
Source name:
World Development Indicators
Source organization:
European Commission, Joint Research Centre (JRC)/Netherlands Environmental Assessment Agency (PBL). Emission Database for Global Atmospheric Research (EDGAR): http://edgar.jrc.ec.europa.eu/
Categories, topics:
Energy & Mining, Environment
Last updated:
apr 23, 2017
Indicators value changes by year
Maximum:
1.054K
jan 1, 2008
At the date of observation
Value
Absolute change
Change from previous value
jan 1, 1971
608.849
+608.849
%
jan 1, 1972
619.031
+10.183
1.67%
jan 1, 1973
659.471
+40.44
6.53%
jan 1, 1974
712.95
+53.479
8.11%
jan 1, 1975
707.663
-5.288
-0.74%
jan 1, 1976
715.681
+8.019
1.13%
jan 1, 1977
723.505
+7.824
1.09%
jan 1, 1978
742.0
+18.495
2.56%
jan 1, 1979
767.545
+25.545
3.44%
jan 1, 1980
761.64
-5.906
-0.77%
jan 1, 1981
759.149
-2.491
-0.33%
jan 1, 1982
756.659
-2.49
-0.33%
jan 1, 1983
758.677
+2.018
0.27%
jan 1, 1984
762.614
+3.937
0.52%
jan 1, 1985
788.931
+26.318
3.45%
jan 1, 1986
798.9
+9.968
1.26%
jan 1, 1987
862.007
+63.107
7.9%
jan 1, 1988
856.66
-5.346
-0.62%
jan 1, 1989
883.758
+27.098
3.16%
jan 1, 1990
880.655
-3.103
-0.35%
jan 1, 1991
734.981
-145.674
-16.54%
jan 1, 1992
740.734
+5.753
0.78%
jan 1, 1993
692.953
-47.781
-6.45%
jan 1, 1994
673.814
-19.139
-2.76%
jan 1, 1995
700.534
+26.719
3.97%
jan 1, 1996
714.366
+13.832
1.97%
jan 1, 1997
695.481
-18.885
-2.64%
jan 1, 1998
725.572
+30.091
4.33%
jan 1, 1999
748.047
+22.475
3.1%
jan 1, 2000
758.31
+10.263
1.37%
jan 1, 2001
809.409
+51.099
6.74%
jan 1, 2002
848.068
+38.659
4.78%
jan 1, 2003
886.508
+38.44
4.53%
jan 1, 2004
905.658
+19.15
2.16%
jan 1, 2005
960.266
+54.608
6.03%
jan 1, 2006
977.272
+17.007
1.77%
jan 1, 2007
1.008K
+30.339
3.1%
jan 1, 2008
1.054K
+46.329
4.6%
jan 1, 2009
1.021K
-32.903
-3.12%
Ranking of countries by current statistics by years


Comments: