29
/
en
AIzaSyAYiBZKx7MnpbEhh9jyipgxe19OcubqV5w
April 1, 2024
185614
Madagascar
MDG
true
2
1
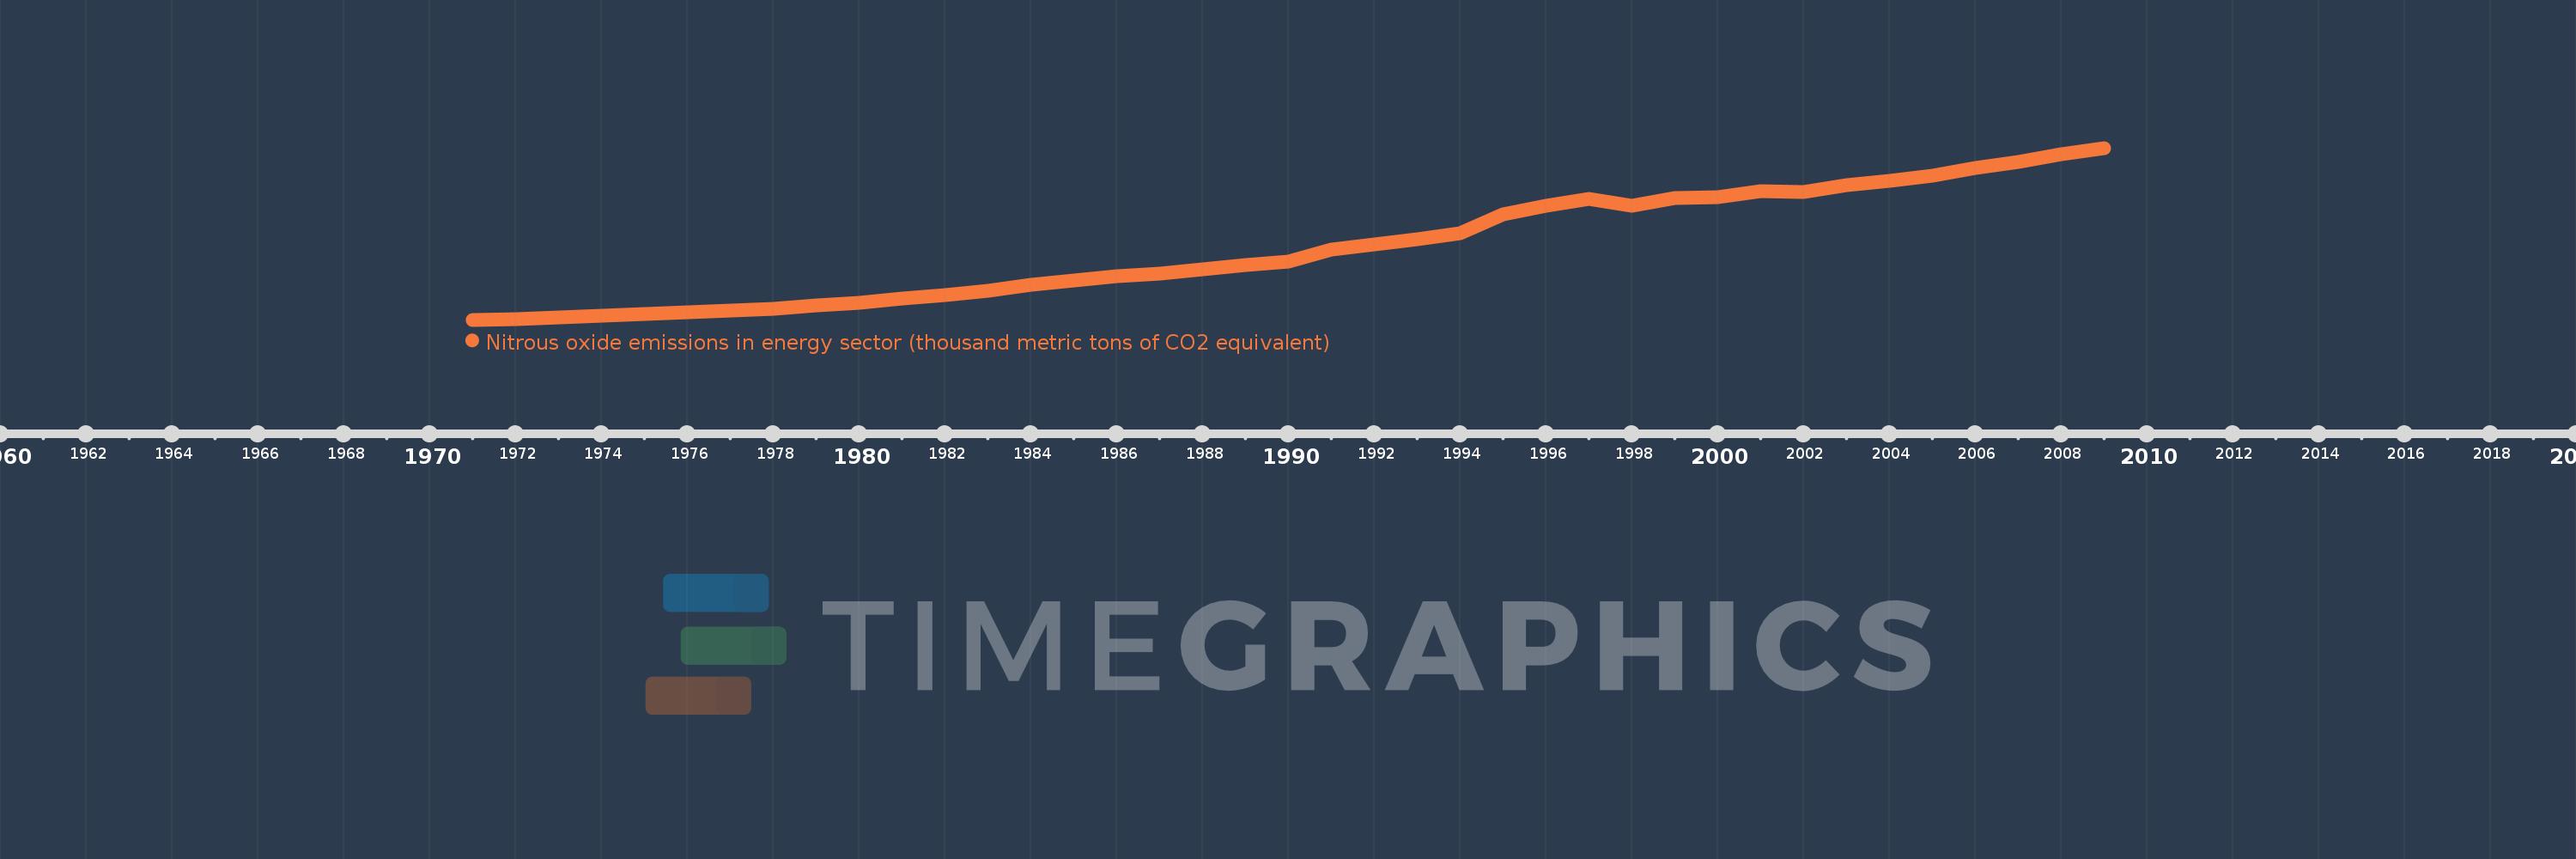
Nitrous oxide emissions in energy sector (thousand metric tons of CO2 equivalent)
2009,2008,2007,2006,2005,2004,2003,2002,2001,2000,1999,1998,1997,1996,1995,1994,1993,1992,1991,1990,1989,1988,1987,1986,1985,1984,1983,1982,1981,1980,1979,1978,1977,1976,1975,1974,1973,1972,1971
This statistics in other country:
AfghanistanAlbaniaAlgeriaAmerican SamoaAndorraAngolaAntigua and BarbudaArab WorldArgentinaArmeniaArubaAustraliaAustriaAzerbaijanBahamas, TheBahrainBangladeshBarbadosBelarusBelgiumBelizeBeninBermudaBhutanBoliviaBosnia and HerzegovinaBotswanaBrazilBritish Virgin IslandsBrunei DarussalamBulgariaBurkina FasoBurundiCabo VerdeCambodiaCameroonCanadaCaribbean small statesCayman IslandsCentral African RepublicCentral Europe and the BalticsChadChannel IslandsChileChinaColombiaComorosCongo, Dem. Rep.Congo, Rep.Costa RicaCote d'IvoireCroatiaCubaCuracaoCyprusCzech RepublicDenmarkDjiboutiDominicaDominican RepublicEarly-demographic dividendEast Asia & PacificEast Asia & Pacific (excluding high income)East Asia & Pacific (IDA & IBRD countries)EcuadorEgypt, Arab Rep.El SalvadorEquatorial GuineaEritreaEstoniaEthiopiaEuro areaEurope & Central AsiaEurope & Central Asia (excluding high income)Europe & Central Asia (IDA & IBRD countries)European UnionFaroe IslandsFijiFinlandFragile and conflict affected situationsFranceFrench PolynesiaGabonGambia, TheGeorgiaGermanyGhanaGibraltarGreeceGreenlandGrenadaGuamGuatemalaGuineaGuinea-BissauGuyanaHaitiHeavily indebted poor countries (HIPC)High incomeHondurasHong Kong SAR, ChinaHungaryIBRD onlyIcelandIDA & IBRD totalIDA blendIDA onlyIDA totalIndiaIndonesiaIran, Islamic Rep.IraqIrelandIsle of ManIsraelItalyJamaicaJapanJordanKazakhstanKenyaKiribatiKorea, Dem. People’s Rep.Korea, Rep.KosovoKuwaitKyrgyz RepublicLao PDRLate-demographic dividendLatin America & Caribbean Latin America & Caribbean (excluding high income)Latin America & the Caribbean (IDA & IBRD countries)LatviaLeast developed countries: UN classificationLebanonLesothoLiberiaLibyaLiechtensteinLithuaniaLow & middle incomeLow incomeLower middle incomeLuxembourgMacao SAR, ChinaMacedonia, FYRMadagascarMalawiMalaysiaMaldivesMaliMaltaMarshall IslandsMauritaniaMauritiusMexicoMicronesia, Fed. Sts.Middle East & North AfricaMiddle East & North Africa (excluding high income)Middle East & North Africa (IDA & IBRD countries)Middle incomeMoldovaMonacoMongoliaMontenegroMoroccoMozambiqueMyanmarNamibiaNauruNepalNetherlandsNew CaledoniaNew ZealandNicaraguaNigerNigeriaNorth AmericaNorthern Mariana IslandsNorwayOECD membersOmanOther small statesPacific island small statesPakistanPalauPanamaPapua New GuineaParaguayPeruPhilippinesPolandPortugalPost-demographic dividendPre-demographic dividendPuerto RicoQatarRomaniaRussian FederationRwandaSamoaSan MarinoSao Tome and PrincipeSaudi ArabiaSenegalSerbiaSeychellesSierra LeoneSingaporeSint Maarten (Dutch part)Slovak RepublicSloveniaSmall statesSolomon IslandsSomaliaSouth AfricaSouth AsiaSouth Asia (IDA & IBRD)South SudanSpainSri LankaSt. Kitts and NevisSt. LuciaSt. Martin (French part)St. Vincent and the GrenadinesSub-Saharan Africa Sub-Saharan Africa (excluding high income)Sub-Saharan Africa (IDA & IBRD countries)SudanSurinameSwazilandSwedenSwitzerlandSyrian Arab RepublicTajikistanTanzaniaThailandTimor-LesteTogoTongaTrinidad and TobagoTunisiaTurkeyTurkmenistanTurks and Caicos IslandsTuvaluUgandaUkraineUnited Arab EmiratesUnited KingdomUnited StatesUpper middle incomeUruguayUzbekistanVanuatuVenezuela, RBVietnamVirgin Islands (U.S.)West Bank and GazaWorldYemen, Rep.ZambiaZimbabwe Timeline:
This timeline shows a graph from 1971 to 2009 of Madagascar. No data until 1970. Number of actual observations by date: 39.
Source name:
World Development Indicators
Source organization:
European Commission, Joint Research Centre (JRC)/Netherlands Environmental Assessment Agency (PBL). Emission Database for Global Atmospheric Research (EDGAR): http://edgar.jrc.ec.europa.eu/
Categories, topics:
Energy & Mining, Environment
Last updated:
apr 23, 2017
Indicators value changes by year
Minimum:
47.711
jan 1, 1971
Maximum:
315.081
jan 1, 2009
At the date of observation
Value
Absolute change
Change from previous value
jan 1, 1971
47.711
+47.711
0.0%
jan 1, 1972
49.156
+1.445
3.03%
jan 1, 1973
51.35
+2.194
4.46%
jan 1, 1974
53.946
+2.597
5.06%
jan 1, 1975
56.252
+2.306
4.27%
jan 1, 1976
59.348
+3.096
5.5%
jan 1, 1977
62.301
+2.953
4.98%
jan 1, 1978
65.278
+2.976
4.78%
jan 1, 1979
69.789
+4.512
6.91%
jan 1, 1980
74.191
+4.401
6.31%
jan 1, 1981
80.912
+6.721
9.06%
jan 1, 1982
85.62
+4.708
5.82%
jan 1, 1983
92.986
+7.366
8.6%
jan 1, 1984
102.179
+9.194
9.89%
jan 1, 1985
108.887
+6.707
6.56%
jan 1, 1986
115.387
+6.5
5.97%
jan 1, 1987
119.764
+4.377
3.79%
jan 1, 1988
126.297
+6.533
5.45%
jan 1, 1989
133.265
+6.968
5.52%
jan 1, 1990
138.359
+5.094
3.82%
jan 1, 1991
156.356
+17.998
13.01%
jan 1, 1992
164.52
+8.164
5.22%
jan 1, 1993
172.946
+8.426
5.12%
jan 1, 1994
181.951
+9.005
5.21%
jan 1, 1995
211.926
+29.975
16.47%
jan 1, 1996
224.827
+12.901
6.09%
jan 1, 1997
235.621
+10.795
4.8%
jan 1, 1998
224.86
-10.761
-4.57%
jan 1, 1999
236.53
+11.67
5.19%
jan 1, 2000
237.87
+1.34
0.57%
jan 1, 2001
247.228
+9.358
3.93%
jan 1, 2002
246.828
-0.4
-0.16%
jan 1, 2003
257.128
+10.3
4.17%
jan 1, 2004
264.231
+7.103
2.76%
jan 1, 2005
271.893
+7.662
2.9%
jan 1, 2006
283.521
+11.628
4.28%
jan 1, 2007
293.731
+10.21
3.6%
jan 1, 2008
304.824
+11.093
3.78%
jan 1, 2009
315.081
+10.258
3.37%
Ranking of countries by current statistics by years


Comments: