29
/
en
AIzaSyAYiBZKx7MnpbEhh9jyipgxe19OcubqV5w
April 1, 2024
228908
Romania
ROU
true
2
1
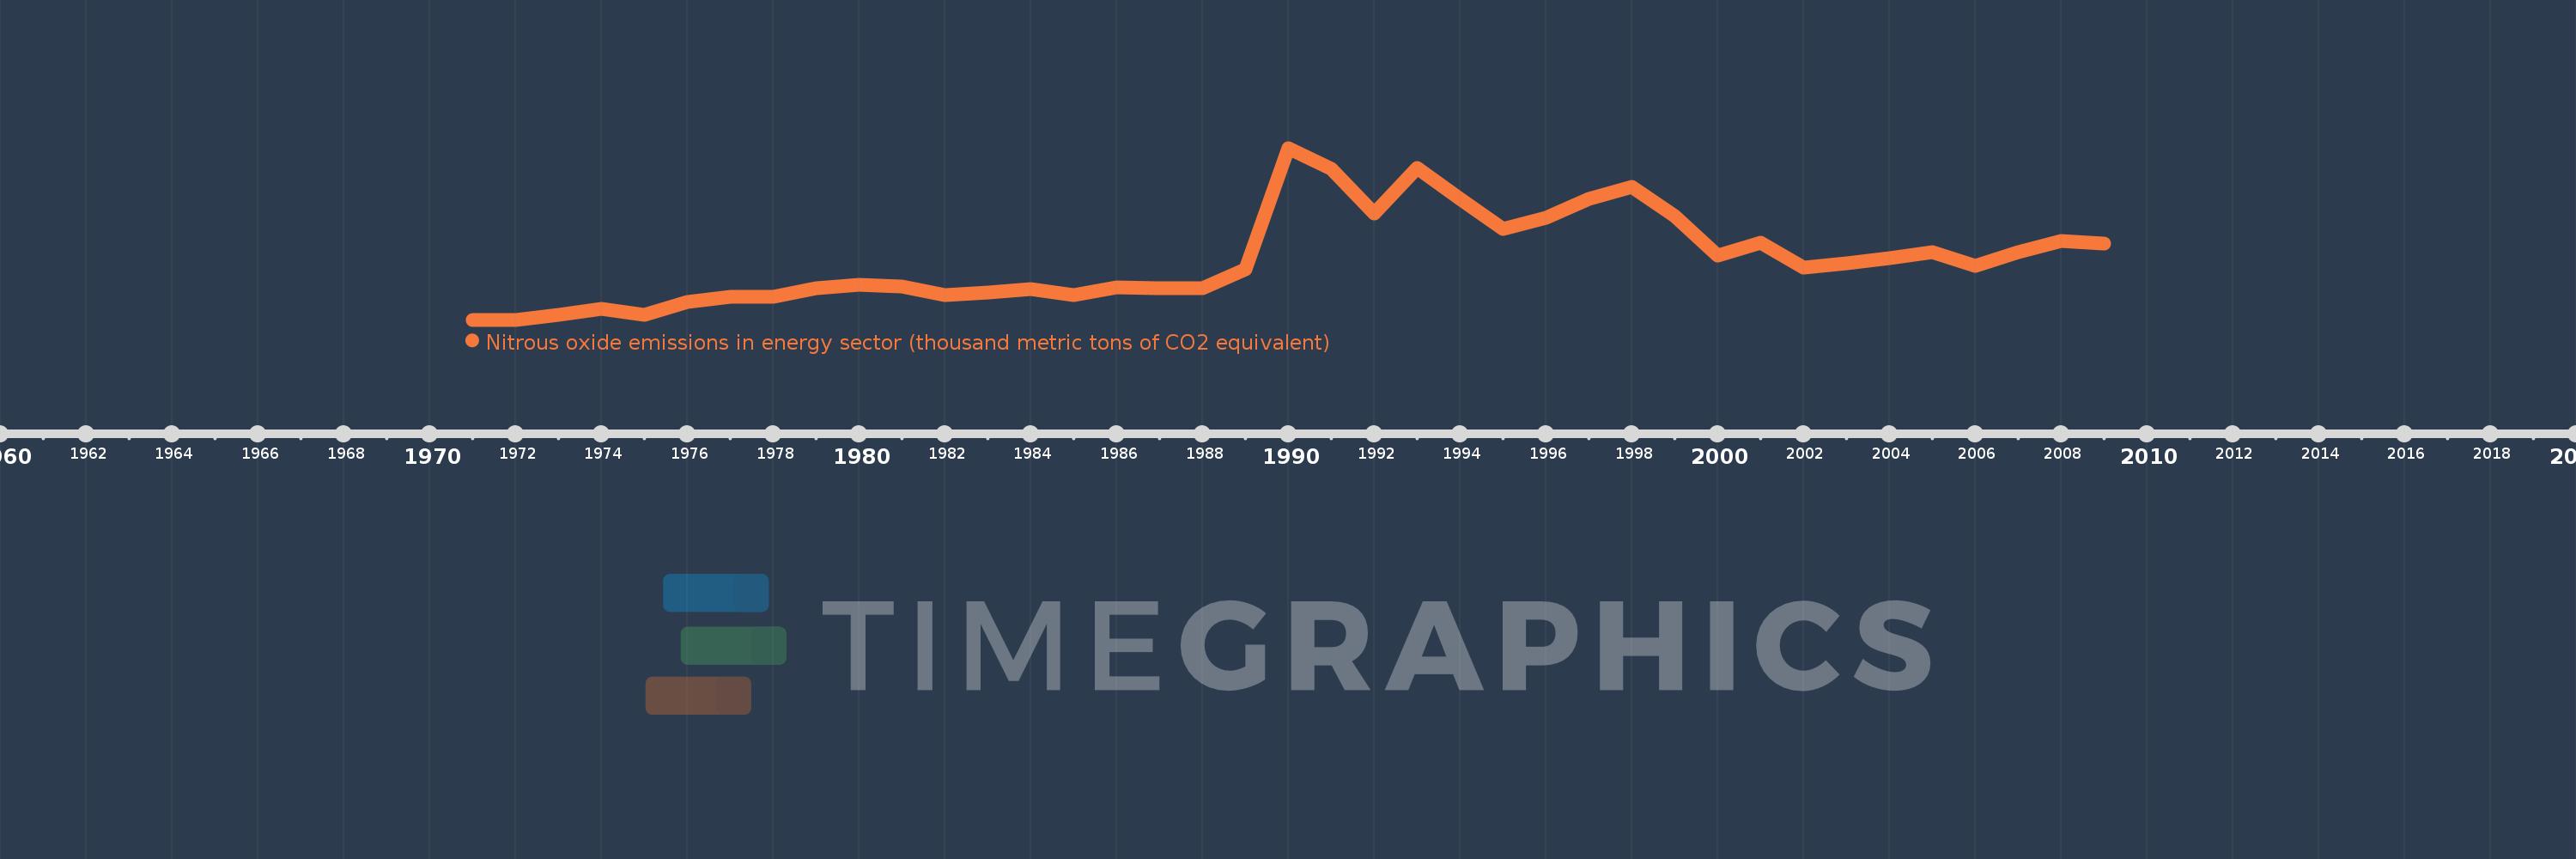
Nitrous oxide emissions in energy sector (thousand metric tons of CO2 equivalent)
2009,2008,2007,2006,2005,2004,2003,2002,2001,2000,1999,1998,1997,1996,1995,1994,1993,1992,1991,1990,1989,1988,1987,1986,1985,1984,1983,1982,1981,1980,1979,1978,1977,1976,1975,1974,1973,1972,1971
This statistics in other country:
AfghanistanAlbaniaAlgeriaAmerican SamoaAndorraAngolaAntigua and BarbudaArab WorldArgentinaArmeniaArubaAustraliaAustriaAzerbaijanBahamas, TheBahrainBangladeshBarbadosBelarusBelgiumBelizeBeninBermudaBhutanBoliviaBosnia and HerzegovinaBotswanaBrazilBritish Virgin IslandsBrunei DarussalamBulgariaBurkina FasoBurundiCabo VerdeCambodiaCameroonCanadaCaribbean small statesCayman IslandsCentral African RepublicCentral Europe and the BalticsChadChannel IslandsChileChinaColombiaComorosCongo, Dem. Rep.Congo, Rep.Costa RicaCote d'IvoireCroatiaCubaCuracaoCyprusCzech RepublicDenmarkDjiboutiDominicaDominican RepublicEarly-demographic dividendEast Asia & PacificEast Asia & Pacific (excluding high income)East Asia & Pacific (IDA & IBRD countries)EcuadorEgypt, Arab Rep.El SalvadorEquatorial GuineaEritreaEstoniaEthiopiaEuro areaEurope & Central AsiaEurope & Central Asia (excluding high income)Europe & Central Asia (IDA & IBRD countries)European UnionFaroe IslandsFijiFinlandFragile and conflict affected situationsFranceFrench PolynesiaGabonGambia, TheGeorgiaGermanyGhanaGibraltarGreeceGreenlandGrenadaGuamGuatemalaGuineaGuinea-BissauGuyanaHaitiHeavily indebted poor countries (HIPC)High incomeHondurasHong Kong SAR, ChinaHungaryIBRD onlyIcelandIDA & IBRD totalIDA blendIDA onlyIDA totalIndiaIndonesiaIran, Islamic Rep.IraqIrelandIsle of ManIsraelItalyJamaicaJapanJordanKazakhstanKenyaKiribatiKorea, Dem. People’s Rep.Korea, Rep.KosovoKuwaitKyrgyz RepublicLao PDRLate-demographic dividendLatin America & Caribbean Latin America & Caribbean (excluding high income)Latin America & the Caribbean (IDA & IBRD countries)LatviaLeast developed countries: UN classificationLebanonLesothoLiberiaLibyaLiechtensteinLithuaniaLow & middle incomeLow incomeLower middle incomeLuxembourgMacao SAR, ChinaMacedonia, FYRMadagascarMalawiMalaysiaMaldivesMaliMaltaMarshall IslandsMauritaniaMauritiusMexicoMicronesia, Fed. Sts.Middle East & North AfricaMiddle East & North Africa (excluding high income)Middle East & North Africa (IDA & IBRD countries)Middle incomeMoldovaMonacoMongoliaMontenegroMoroccoMozambiqueMyanmarNamibiaNauruNepalNetherlandsNew CaledoniaNew ZealandNicaraguaNigerNigeriaNorth AmericaNorthern Mariana IslandsNorwayOECD membersOmanOther small statesPacific island small statesPakistanPalauPanamaPapua New GuineaParaguayPeruPhilippinesPolandPortugalPost-demographic dividendPre-demographic dividendPuerto RicoQatarRomaniaRussian FederationRwandaSamoaSan MarinoSao Tome and PrincipeSaudi ArabiaSenegalSerbiaSeychellesSierra LeoneSingaporeSint Maarten (Dutch part)Slovak RepublicSloveniaSmall statesSolomon IslandsSomaliaSouth AfricaSouth AsiaSouth Asia (IDA & IBRD)South SudanSpainSri LankaSt. Kitts and NevisSt. LuciaSt. Martin (French part)St. Vincent and the GrenadinesSub-Saharan Africa Sub-Saharan Africa (excluding high income)Sub-Saharan Africa (IDA & IBRD countries)SudanSurinameSwazilandSwedenSwitzerlandSyrian Arab RepublicTajikistanTanzaniaThailandTimor-LesteTogoTongaTrinidad and TobagoTunisiaTurkeyTurkmenistanTurks and Caicos IslandsTuvaluUgandaUkraineUnited Arab EmiratesUnited KingdomUnited StatesUpper middle incomeUruguayUzbekistanVanuatuVenezuela, RBVietnamVirgin Islands (U.S.)West Bank and GazaWorldYemen, Rep.ZambiaZimbabwe Timeline:
This timeline shows a graph from 1971 to 2009 of Romania. No data until 1970. Number of actual observations by date: 39.
Source name:
World Development Indicators
Source organization:
European Commission, Joint Research Centre (JRC)/Netherlands Environmental Assessment Agency (PBL). Emission Database for Global Atmospheric Research (EDGAR): http://edgar.jrc.ec.europa.eu/
Categories, topics:
Energy & Mining, Environment
Last updated:
apr 23, 2017
Indicators value changes by year
Minimum:
309.833
jan 1, 1972
Maximum:
903.71
jan 1, 1990
At the date of observation
Value
Absolute change
Change from previous value
jan 1, 1971
310.147
+310.147
0.0%
jan 1, 1972
309.833
-0.314
-0.1%
jan 1, 1973
326.302
+16.469
5.32%
jan 1, 1974
347.01
+20.708
6.35%
jan 1, 1975
328.095
-18.916
-5.45%
jan 1, 1976
370.069
+41.974
12.79%
jan 1, 1977
390.267
+20.199
5.46%
jan 1, 1978
389.017
-1.25
-0.32%
jan 1, 1979
420.238
+31.22
8.03%
jan 1, 1980
429.859
+9.621
2.29%
jan 1, 1981
425.385
-4.474
-1.04%
jan 1, 1982
393.769
-31.616
-7.43%
jan 1, 1983
402.678
+8.909
2.26%
jan 1, 1984
417.053
+14.376
3.57%
jan 1, 1985
396.113
-20.94
-5.02%
jan 1, 1986
421.388
+25.275
6.38%
jan 1, 1987
419.743
-1.645
-0.39%
jan 1, 1988
419.763
+0.02
0.0%
jan 1, 1989
483.575
+63.812
15.2%
jan 1, 1990
903.71
+420.135
86.88%
jan 1, 1991
831.315
-72.395
-8.01%
jan 1, 1992
677.467
-153.848
-18.51%
jan 1, 1993
835.964
+158.497
23.4%
jan 1, 1994
727.595
-108.369
-12.96%
jan 1, 1995
624.919
-102.676
-14.11%
jan 1, 1996
662.561
+37.642
6.02%
jan 1, 1997
727.1
+64.54
9.74%
jan 1, 1998
768.56
+41.459
5.7%
jan 1, 1999
667.226
-101.334
-13.18%
jan 1, 2000
532.74
-134.485
-20.16%
jan 1, 2001
575.561
+42.821
8.04%
jan 1, 2002
488.972
-86.589
-15.04%
jan 1, 2003
504.226
+15.254
3.12%
jan 1, 2004
524.041
+19.815
3.93%
jan 1, 2005
542.865
+18.823
3.59%
jan 1, 2006
494.615
-48.25
-8.89%
jan 1, 2007
543.074
+48.459
9.8%
jan 1, 2008
582.664
+39.59
7.29%
jan 1, 2009
572.65
-10.014
-1.72%
Ranking of countries by current statistics by years


Comments: