29
/
en
AIzaSyAYiBZKx7MnpbEhh9jyipgxe19OcubqV5w
April 1, 2024
94481
Burkina Faso
BFA
true
2
1
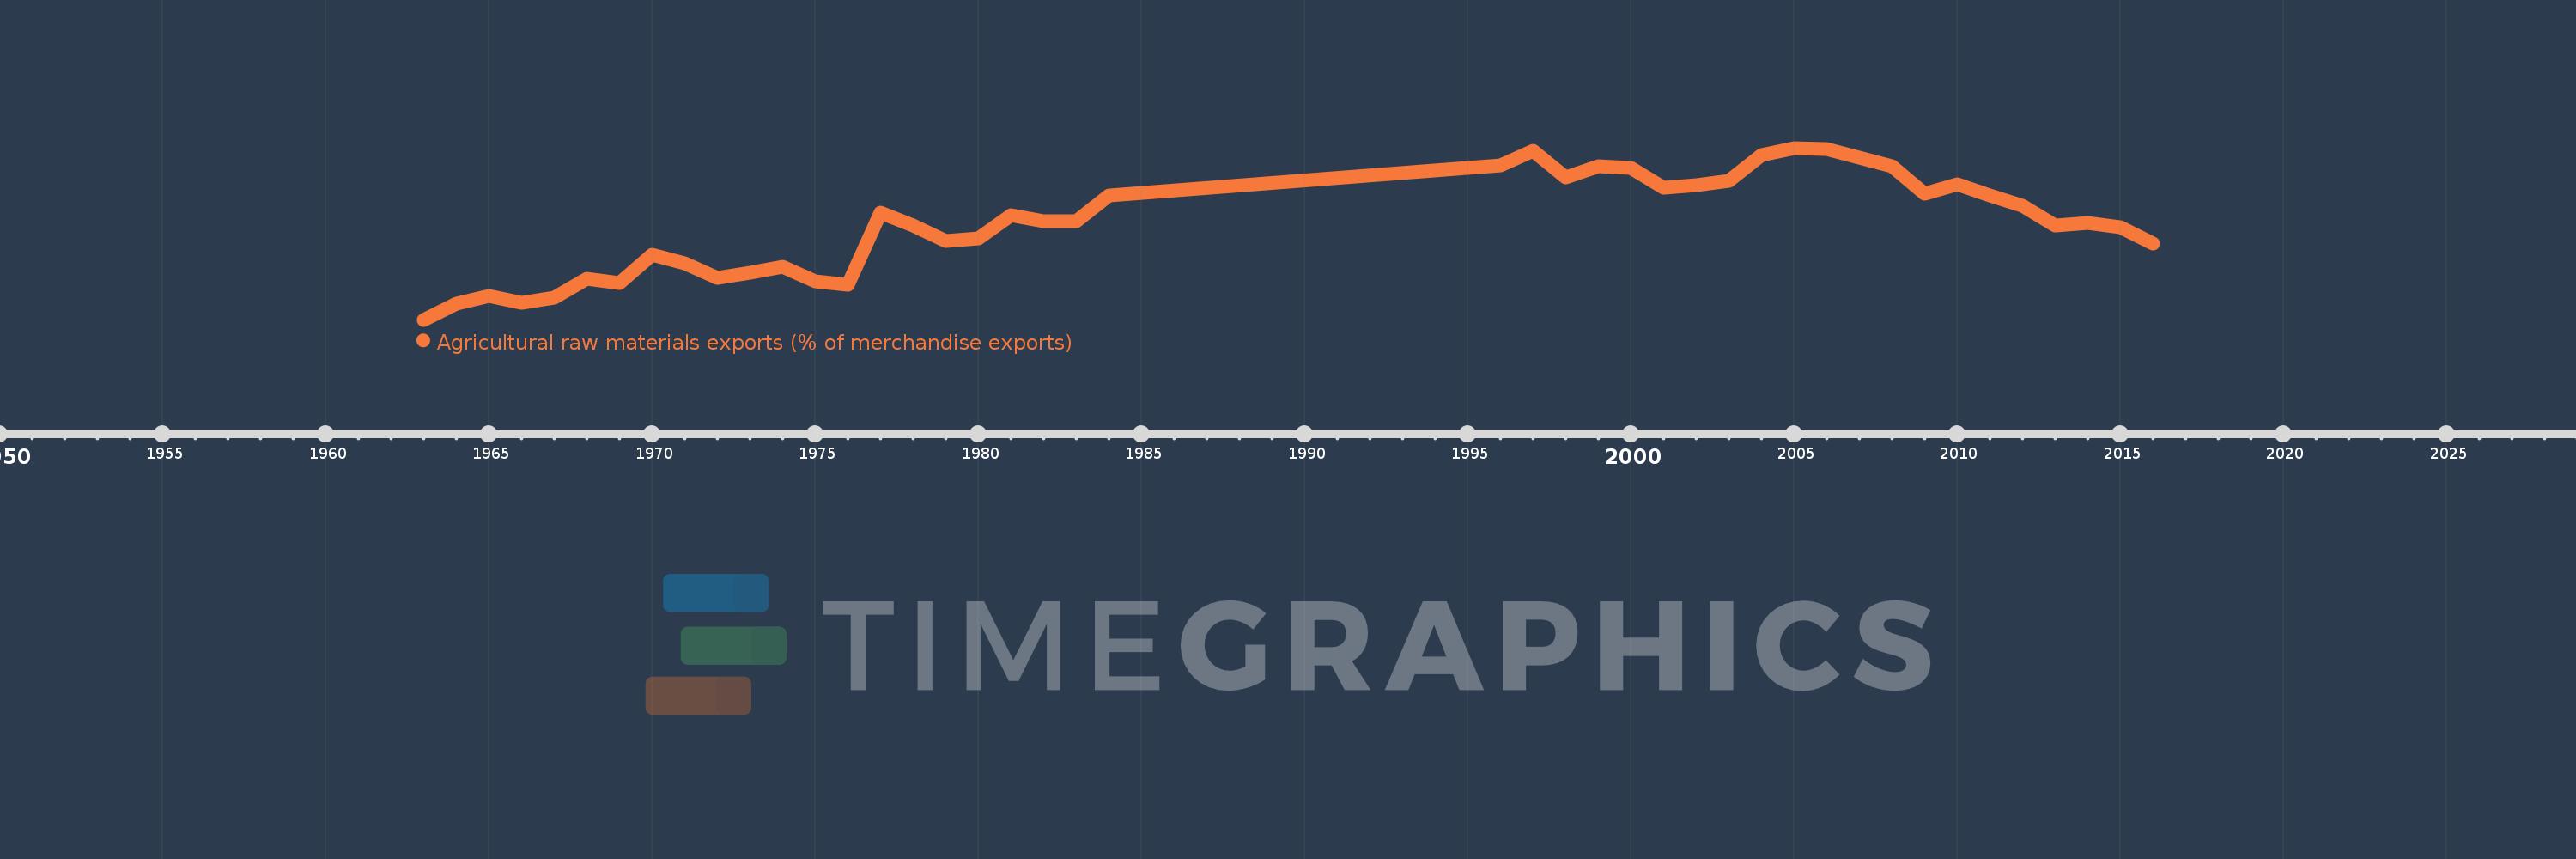
Agricultural raw materials exports (% of merchandise exports)
2016,2015,2014,2013,2012,2011,2010,2009,2008,2006,2005,2004,2003,2002,2001,2000,1999,1998,1997,1996,1984,1983,1982,1981,1980,1979,1978,1977,1976,1975,1974,1973,1972,1971,1970,1969,1968,1967,1966,1965,1964,1963
This statistics in other country:
AfghanistanAlbaniaAlgeriaAndorraAngolaAntigua and BarbudaArab WorldArgentinaArmeniaArubaAustraliaAustriaAzerbaijanBahamas, TheBahrainBangladeshBarbadosBelarusBelgiumBelizeBeninBermudaBhutanBoliviaBosnia and HerzegovinaBotswanaBrazilBrunei DarussalamBulgariaBurkina FasoBurundiCabo VerdeCambodiaCameroonCanadaCaribbean small statesCayman IslandsCentral African RepublicCentral Europe and the BalticsChadChileChinaColombiaComorosCongo, Dem. Rep.Congo, Rep.Costa RicaCote d'IvoireCroatiaCubaCyprusCzech RepublicDenmarkDjiboutiDominicaDominican RepublicEarly-demographic dividendEast Asia & PacificEast Asia & Pacific (excluding high income)East Asia & Pacific (IDA & IBRD countries)EcuadorEgypt, Arab Rep.El SalvadorEquatorial GuineaEritreaEstoniaEthiopiaEuro areaEurope & Central AsiaEurope & Central Asia (excluding high income)Europe & Central Asia (IDA & IBRD countries)European UnionFaroe IslandsFijiFinlandFragile and conflict affected situationsFranceFrench PolynesiaGabonGambia, TheGeorgiaGermanyGhanaGreeceGreenlandGrenadaGuatemalaGuineaGuinea-BissauGuyanaHaitiHeavily indebted poor countries (HIPC)High incomeHondurasHong Kong SAR, ChinaHungaryIBRD onlyIcelandIDA & IBRD totalIDA blendIDA onlyIDA totalIndiaIndonesiaIran, Islamic Rep.IraqIrelandIsraelItalyJamaicaJapanJordanKazakhstanKenyaKiribatiKorea, Rep.KuwaitKyrgyz RepublicLao PDRLate-demographic dividendLatin America & Caribbean Latin America & Caribbean (excluding high income)Latin America & the Caribbean (IDA & IBRD countries)LatviaLeast developed countries: UN classificationLebanonLesothoLiberiaLibyaLithuaniaLow & middle incomeLower middle incomeLuxembourgMacao SAR, ChinaMacedonia, FYRMadagascarMalawiMalaysiaMaldivesMaliMaltaMauritaniaMauritiusMexicoMiddle East & North AfricaMiddle East & North Africa (excluding high income)Middle East & North Africa (IDA & IBRD countries)Middle incomeMoldovaMongoliaMoroccoMozambiqueMyanmarNamibiaNepalNetherlandsNew CaledoniaNew ZealandNicaraguaNigerNigeriaNorth AmericaNorwayOECD membersOmanOther small statesPacific island small statesPakistanPalauPanamaPapua New GuineaParaguayPeruPhilippinesPolandPortugalPost-demographic dividendPre-demographic dividendQatarRomaniaRussian FederationRwandaSamoaSao Tome and PrincipeSaudi ArabiaSenegalSerbiaSeychellesSierra LeoneSingaporeSlovak RepublicSloveniaSmall statesSolomon IslandsSomaliaSouth AfricaSouth AsiaSouth Asia (IDA & IBRD)SpainSri LankaSt. Kitts and NevisSt. LuciaSt. Vincent and the GrenadinesSub-Saharan Africa Sub-Saharan Africa (excluding high income)Sub-Saharan Africa (IDA & IBRD countries)SudanSurinameSwazilandSwedenSwitzerlandSyrian Arab RepublicTajikistanTanzaniaThailandTimor-LesteTogoTongaTrinidad and TobagoTunisiaTurkeyTurkmenistanTurks and Caicos IslandsTuvaluUgandaUkraineUnited Arab EmiratesUnited KingdomUnited StatesUpper middle incomeUruguayVanuatuVenezuela, RBVietnamVirgin Islands (U.S.)WorldYemen, Rep.ZambiaZimbabwe Timeline:
This timeline shows a graph from 1963 to 2016 of Burkina Faso. No data until 1962. Number of actual observations by date: 42.
Source name:
World Development Indicators
Source organization:
World Bank staff estimates from the Comtrade database maintained by the United Nations Statistics Division.
Categories, topics:
Agriculture & Rural Development, Private Sector, Trade
Last updated:
apr 23, 2017
Indicators value changes by year
Maximum:
75.878
jan 1, 2005
At the date of observation
Value
Absolute change
Change from previous value
jan 1, 1963
3.816
+3.816
0.0%
jan 1, 1964
10.516
+6.7
175.55%
jan 1, 1965
13.75
+3.234
30.75%
jan 1, 1966
10.826
-2.924
-21.26%
jan 1, 1967
12.923
+2.097
19.37%
jan 1, 1968
20.936
+8.013
62.0%
jan 1, 1969
19.21
-1.726
-8.25%
jan 1, 1970
30.976
+11.766
61.25%
jan 1, 1971
27.564
-3.412
-11.01%
jan 1, 1972
21.218
-6.346
-23.02%
jan 1, 1973
23.353
+2.135
10.06%
jan 1, 1974
26.207
+2.854
12.22%
jan 1, 1975
19.839
-6.368
-24.3%
jan 1, 1976
18.609
-1.231
-6.2%
jan 1, 1977
48.585
+29.977
161.09%
jan 1, 1978
43.208
-5.378
-11.07%
jan 1, 1979
36.779
-6.429
-14.88%
jan 1, 1980
37.897
+1.118
3.04%
jan 1, 1981
47.679
+9.782
25.81%
jan 1, 1982
45.289
-2.391
-5.01%
jan 1, 1983
45.277
-0.012
-0.03%
jan 1, 1984
55.946
+10.669
23.56%
jan 1, 1996
68.725
+12.779
22.84%
jan 1, 1997
74.515
+5.79
8.42%
jan 1, 1998
63.599
-10.916
-14.65%
jan 1, 1999
68.143
+4.544
7.14%
jan 1, 2000
67.621
-0.521
-0.77%
jan 1, 2001
59.163
-8.458
-12.51%
jan 1, 2002
60.365
+1.201
2.03%
jan 1, 2003
61.903
+1.538
2.55%
jan 1, 2004
73.0
+11.098
17.93%
jan 1, 2005
75.878
+2.878
3.94%
jan 1, 2006
75.412
-0.466
-0.61%
jan 1, 2008
68.264
-7.148
-9.48%
jan 1, 2009
56.575
-11.689
-17.12%
jan 1, 2010
60.457
+3.882
6.86%
jan 1, 2011
55.88
-4.577
-7.57%
jan 1, 2012
51.716
-4.164
-7.45%
jan 1, 2013
43.47
-8.246
-15.94%
jan 1, 2014
44.37
+0.9
2.07%
jan 1, 2015
42.477
-1.892
-4.27%
jan 1, 2016
35.881
-6.596
-15.53%
Ranking of countries by current statistics by years


Comments: