29
/
en
AIzaSyAYiBZKx7MnpbEhh9jyipgxe19OcubqV5w
April 1, 2024
184809
Madagascar
MDG
true
2
1
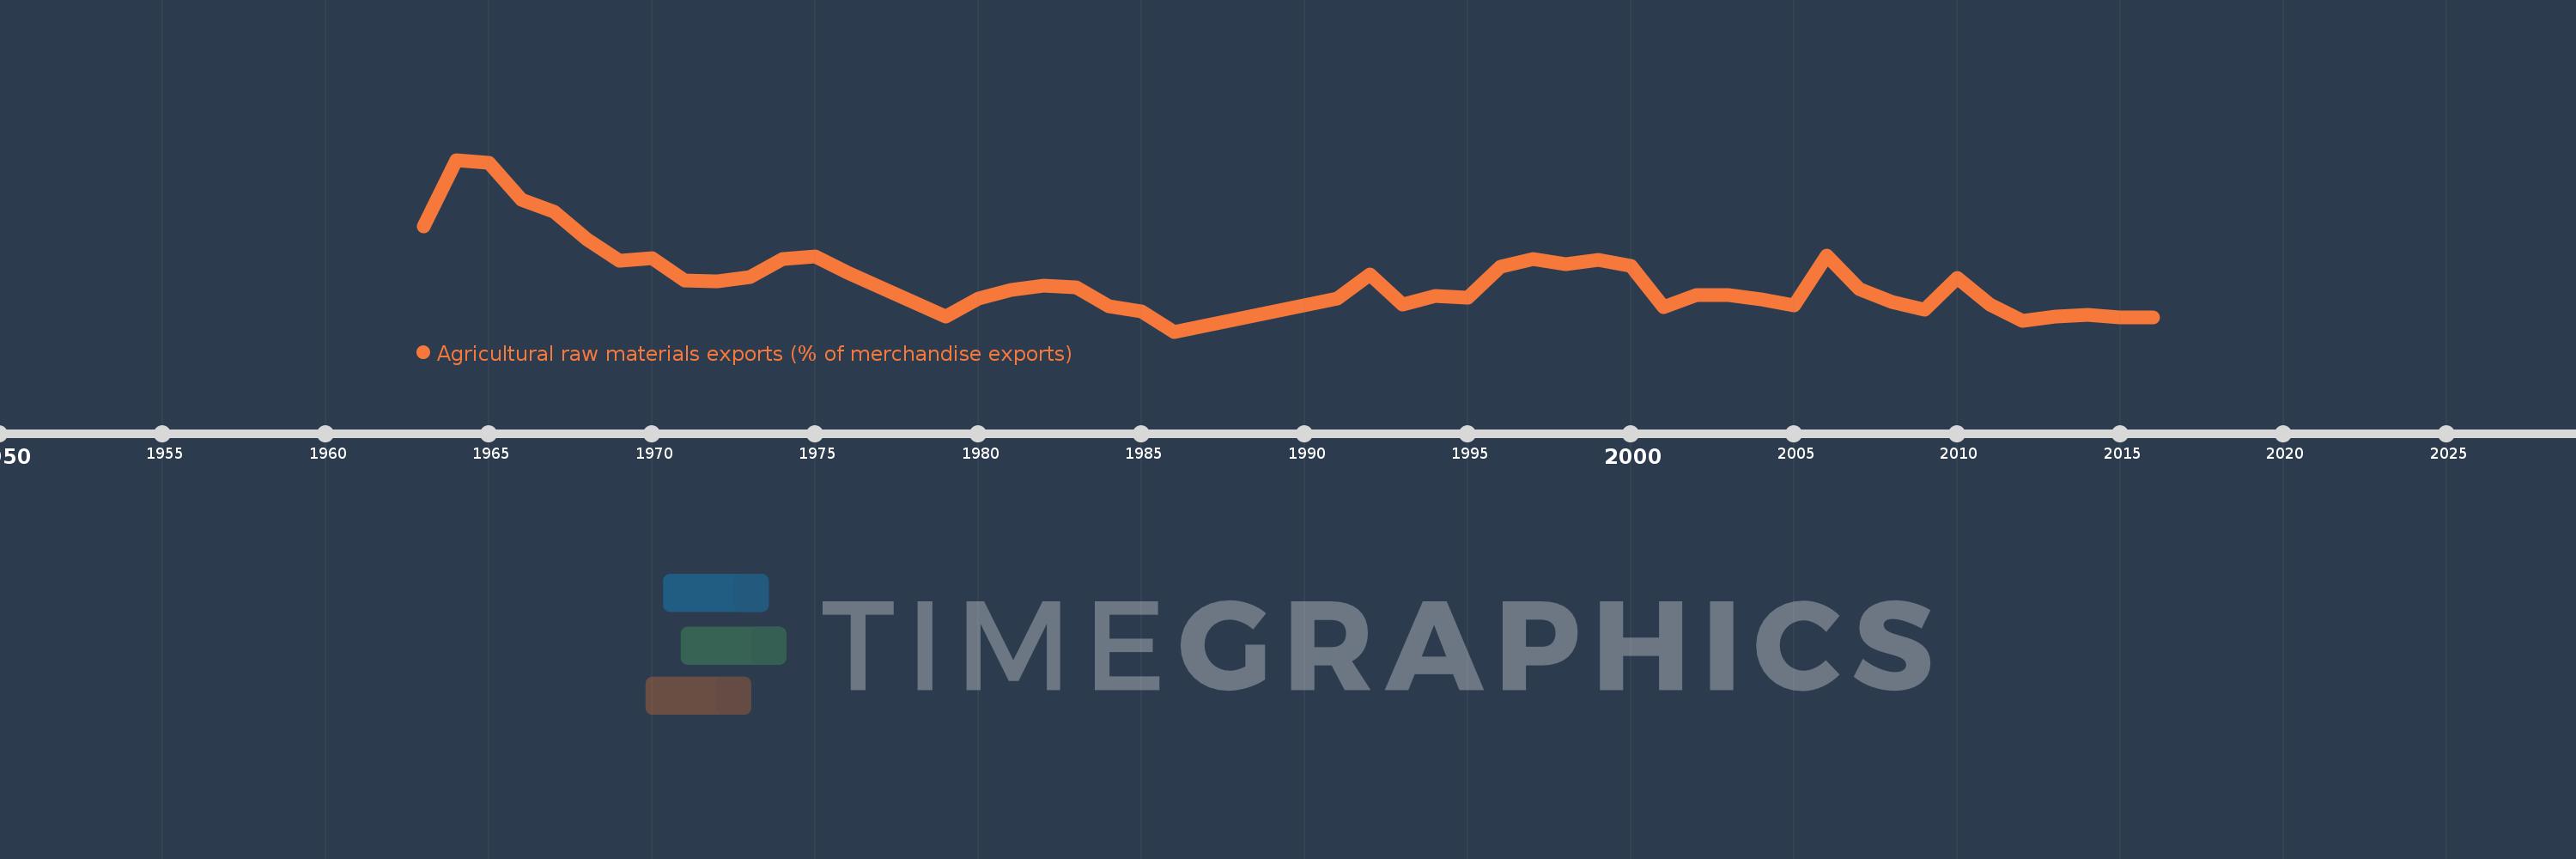
Agricultural raw materials exports (% of merchandise exports)
2016,2015,2014,2013,2012,2011,2010,2009,2008,2007,2006,2005,2004,2003,2002,2001,2000,1999,1998,1997,1996,1995,1994,1993,1992,1991,1986,1985,1984,1983,1982,1981,1980,1979,1978,1977,1976,1975,1974,1973,1972,1971,1970,1969,1968,1967,1966,1965,1964,1963
This statistics in other country:
AfghanistanAlbaniaAlgeriaAndorraAngolaAntigua and BarbudaArab WorldArgentinaArmeniaArubaAustraliaAustriaAzerbaijanBahamas, TheBahrainBangladeshBarbadosBelarusBelgiumBelizeBeninBermudaBhutanBoliviaBosnia and HerzegovinaBotswanaBrazilBrunei DarussalamBulgariaBurkina FasoBurundiCabo VerdeCambodiaCameroonCanadaCaribbean small statesCayman IslandsCentral African RepublicCentral Europe and the BalticsChadChileChinaColombiaComorosCongo, Dem. Rep.Congo, Rep.Costa RicaCote d'IvoireCroatiaCubaCyprusCzech RepublicDenmarkDjiboutiDominicaDominican RepublicEarly-demographic dividendEast Asia & PacificEast Asia & Pacific (excluding high income)East Asia & Pacific (IDA & IBRD countries)EcuadorEgypt, Arab Rep.El SalvadorEquatorial GuineaEritreaEstoniaEthiopiaEuro areaEurope & Central AsiaEurope & Central Asia (excluding high income)Europe & Central Asia (IDA & IBRD countries)European UnionFaroe IslandsFijiFinlandFragile and conflict affected situationsFranceFrench PolynesiaGabonGambia, TheGeorgiaGermanyGhanaGreeceGreenlandGrenadaGuatemalaGuineaGuinea-BissauGuyanaHaitiHeavily indebted poor countries (HIPC)High incomeHondurasHong Kong SAR, ChinaHungaryIBRD onlyIcelandIDA & IBRD totalIDA blendIDA onlyIDA totalIndiaIndonesiaIran, Islamic Rep.IraqIrelandIsraelItalyJamaicaJapanJordanKazakhstanKenyaKiribatiKorea, Rep.KuwaitKyrgyz RepublicLao PDRLate-demographic dividendLatin America & Caribbean Latin America & Caribbean (excluding high income)Latin America & the Caribbean (IDA & IBRD countries)LatviaLeast developed countries: UN classificationLebanonLesothoLiberiaLibyaLithuaniaLow & middle incomeLower middle incomeLuxembourgMacao SAR, ChinaMacedonia, FYRMadagascarMalawiMalaysiaMaldivesMaliMaltaMauritaniaMauritiusMexicoMiddle East & North AfricaMiddle East & North Africa (excluding high income)Middle East & North Africa (IDA & IBRD countries)Middle incomeMoldovaMongoliaMoroccoMozambiqueMyanmarNamibiaNepalNetherlandsNew CaledoniaNew ZealandNicaraguaNigerNigeriaNorth AmericaNorwayOECD membersOmanOther small statesPacific island small statesPakistanPalauPanamaPapua New GuineaParaguayPeruPhilippinesPolandPortugalPost-demographic dividendPre-demographic dividendQatarRomaniaRussian FederationRwandaSamoaSao Tome and PrincipeSaudi ArabiaSenegalSerbiaSeychellesSierra LeoneSingaporeSlovak RepublicSloveniaSmall statesSolomon IslandsSomaliaSouth AfricaSouth AsiaSouth Asia (IDA & IBRD)SpainSri LankaSt. Kitts and NevisSt. LuciaSt. Vincent and the GrenadinesSub-Saharan Africa Sub-Saharan Africa (excluding high income)Sub-Saharan Africa (IDA & IBRD countries)SudanSurinameSwazilandSwedenSwitzerlandSyrian Arab RepublicTajikistanTanzaniaThailandTimor-LesteTogoTongaTrinidad and TobagoTunisiaTurkeyTurkmenistanTurks and Caicos IslandsTuvaluUgandaUkraineUnited Arab EmiratesUnited KingdomUnited StatesUpper middle incomeUruguayVanuatuVenezuela, RBVietnamVirgin Islands (U.S.)WorldYemen, Rep.ZambiaZimbabwe Timeline:
This timeline shows a graph from 1963 to 2016 of Madagascar. No data until 1962. Number of actual observations by date: 50.
Source name:
World Development Indicators
Source organization:
World Bank staff estimates from the Comtrade database maintained by the United Nations Statistics Division.
Categories, topics:
Agriculture & Rural Development, Private Sector, Trade
Last updated:
apr 23, 2017
Indicators value changes by year
Maximum:
14.018
jan 1, 1964
At the date of observation
Value
Absolute change
Change from previous value
jan 1, 1963
9.031
+9.031
0.0%
jan 1, 1964
14.018
+4.987
55.21%
jan 1, 1965
13.774
-0.244
-1.74%
jan 1, 1966
11.028
-2.746
-19.94%
jan 1, 1967
10.158
-0.87
-7.89%
jan 1, 1968
8.064
-2.094
-20.61%
jan 1, 1969
6.486
-1.578
-19.57%
jan 1, 1970
6.656
+0.17
2.62%
jan 1, 1971
4.965
-1.692
-25.42%
jan 1, 1972
4.937
-0.027
-0.55%
jan 1, 1973
5.28
+0.343
6.94%
jan 1, 1974
6.593
+1.313
24.88%
jan 1, 1975
6.776
+0.183
2.77%
jan 1, 1976
5.573
-1.203
-17.76%
jan 1, 1977
4.492
-1.081
-19.4%
jan 1, 1978
3.408
-1.083
-24.12%
jan 1, 1979
2.314
-1.095
-32.12%
jan 1, 1980
3.623
+1.31
56.6%
jan 1, 1981
4.261
+0.638
17.61%
jan 1, 1982
4.642
+0.381
8.94%
jan 1, 1983
4.474
-0.168
-3.62%
jan 1, 1984
3.099
-1.376
-30.74%
jan 1, 1985
2.708
-0.391
-12.61%
jan 1, 1986
1.176
-1.532
-56.58%
jan 1, 1991
3.673
+2.497
212.31%
jan 1, 1992
5.471
+1.798
48.96%
jan 1, 1993
3.208
-2.263
-41.37%
jan 1, 1994
3.82
+0.613
19.1%
jan 1, 1995
3.691
-0.129
-3.39%
jan 1, 1996
5.999
+2.309
62.55%
jan 1, 1997
6.623
+0.623
10.39%
jan 1, 1998
6.225
-0.397
-6.0%
jan 1, 1999
6.541
+0.316
5.07%
jan 1, 2000
6.112
-0.429
-6.56%
jan 1, 2001
3.024
-3.089
-50.53%
jan 1, 2002
3.914
+0.891
29.45%
jan 1, 2003
3.89
-0.025
-0.63%
jan 1, 2004
3.6
-0.289
-7.44%
jan 1, 2005
3.155
-0.445
-12.37%
jan 1, 2006
6.879
+3.723
118.01%
jan 1, 2007
4.37
-2.509
-36.47%
jan 1, 2008
3.418
-0.952
-21.79%
jan 1, 2009
2.845
-0.573
-16.76%
jan 1, 2010
5.187
+2.343
82.35%
jan 1, 2011
3.167
-2.021
-38.96%
jan 1, 2012
1.97
-1.197
-37.8%
jan 1, 2013
2.327
+0.357
18.14%
jan 1, 2014
2.436
+0.109
4.69%
jan 1, 2015
2.259
-0.177
-7.26%
jan 1, 2016
2.229
-0.03
-1.32%
Ranking of countries by current statistics by years


Comments: