29
/
en
AIzaSyAYiBZKx7MnpbEhh9jyipgxe19OcubqV5w
April 1, 2024
209977
Nicaragua
NIC
true
2
1
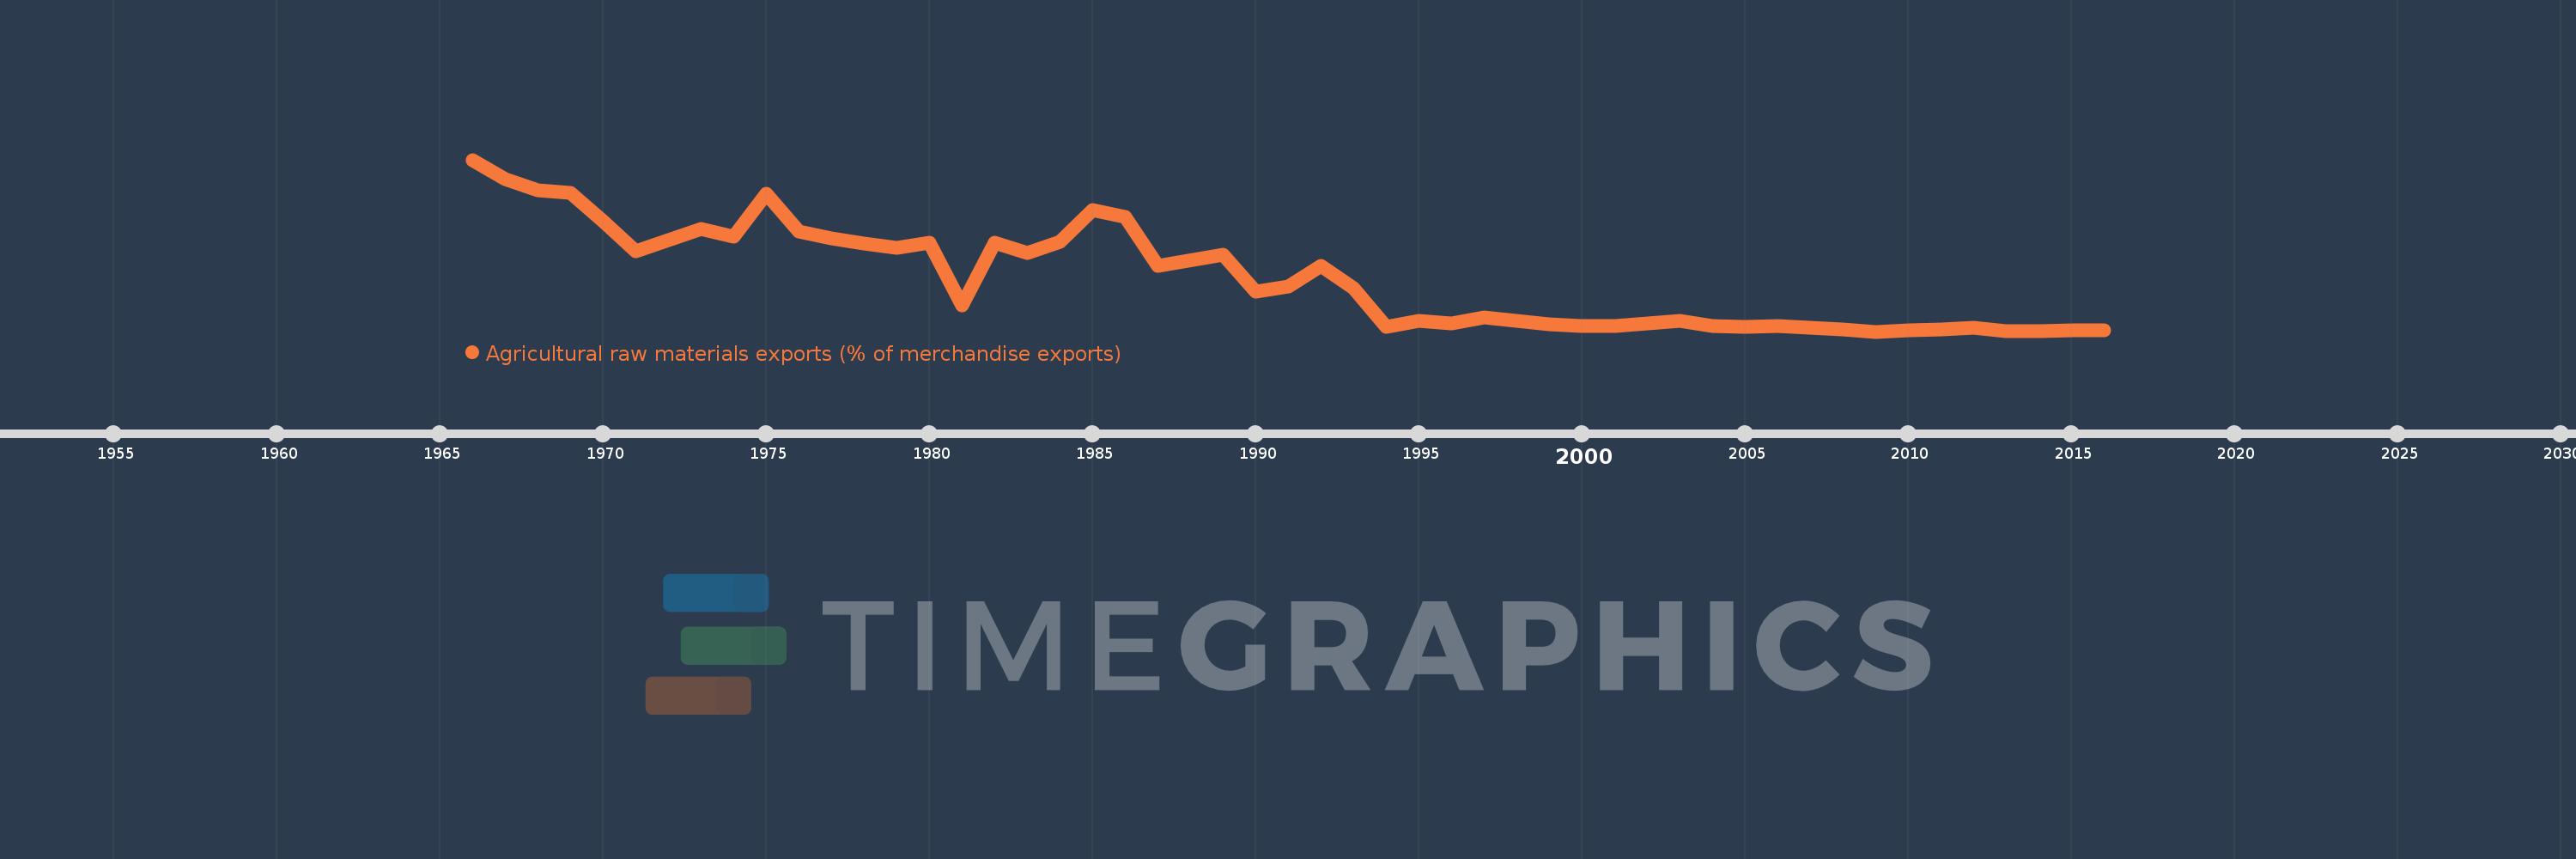
Agricultural raw materials exports (% of merchandise exports)
2016,2015,2014,2013,2012,2011,2010,2009,2008,2007,2006,2005,2004,2003,2002,2001,2000,1999,1998,1997,1996,1995,1994,1993,1992,1991,1990,1989,1987,1986,1985,1984,1983,1982,1981,1980,1979,1978,1977,1976,1975,1974,1973,1972,1971,1970,1969,1968,1967,1966
This statistics in other country:
AfghanistanAlbaniaAlgeriaAndorraAngolaAntigua and BarbudaArab WorldArgentinaArmeniaArubaAustraliaAustriaAzerbaijanBahamas, TheBahrainBangladeshBarbadosBelarusBelgiumBelizeBeninBermudaBhutanBoliviaBosnia and HerzegovinaBotswanaBrazilBrunei DarussalamBulgariaBurkina FasoBurundiCabo VerdeCambodiaCameroonCanadaCaribbean small statesCayman IslandsCentral African RepublicCentral Europe and the BalticsChadChileChinaColombiaComorosCongo, Dem. Rep.Congo, Rep.Costa RicaCote d'IvoireCroatiaCubaCyprusCzech RepublicDenmarkDjiboutiDominicaDominican RepublicEarly-demographic dividendEast Asia & PacificEast Asia & Pacific (excluding high income)East Asia & Pacific (IDA & IBRD countries)EcuadorEgypt, Arab Rep.El SalvadorEquatorial GuineaEritreaEstoniaEthiopiaEuro areaEurope & Central AsiaEurope & Central Asia (excluding high income)Europe & Central Asia (IDA & IBRD countries)European UnionFaroe IslandsFijiFinlandFragile and conflict affected situationsFranceFrench PolynesiaGabonGambia, TheGeorgiaGermanyGhanaGreeceGreenlandGrenadaGuatemalaGuineaGuinea-BissauGuyanaHaitiHeavily indebted poor countries (HIPC)High incomeHondurasHong Kong SAR, ChinaHungaryIBRD onlyIcelandIDA & IBRD totalIDA blendIDA onlyIDA totalIndiaIndonesiaIran, Islamic Rep.IraqIrelandIsraelItalyJamaicaJapanJordanKazakhstanKenyaKiribatiKorea, Rep.KuwaitKyrgyz RepublicLao PDRLate-demographic dividendLatin America & Caribbean Latin America & Caribbean (excluding high income)Latin America & the Caribbean (IDA & IBRD countries)LatviaLeast developed countries: UN classificationLebanonLesothoLiberiaLibyaLithuaniaLow & middle incomeLower middle incomeLuxembourgMacao SAR, ChinaMacedonia, FYRMadagascarMalawiMalaysiaMaldivesMaliMaltaMauritaniaMauritiusMexicoMiddle East & North AfricaMiddle East & North Africa (excluding high income)Middle East & North Africa (IDA & IBRD countries)Middle incomeMoldovaMongoliaMoroccoMozambiqueMyanmarNamibiaNepalNetherlandsNew CaledoniaNew ZealandNicaraguaNigerNigeriaNorth AmericaNorwayOECD membersOmanOther small statesPacific island small statesPakistanPalauPanamaPapua New GuineaParaguayPeruPhilippinesPolandPortugalPost-demographic dividendPre-demographic dividendQatarRomaniaRussian FederationRwandaSamoaSao Tome and PrincipeSaudi ArabiaSenegalSerbiaSeychellesSierra LeoneSingaporeSlovak RepublicSloveniaSmall statesSolomon IslandsSomaliaSouth AfricaSouth AsiaSouth Asia (IDA & IBRD)SpainSri LankaSt. Kitts and NevisSt. LuciaSt. Vincent and the GrenadinesSub-Saharan Africa Sub-Saharan Africa (excluding high income)Sub-Saharan Africa (IDA & IBRD countries)SudanSurinameSwazilandSwedenSwitzerlandSyrian Arab RepublicTajikistanTanzaniaThailandTimor-LesteTogoTongaTrinidad and TobagoTunisiaTurkeyTurkmenistanTurks and Caicos IslandsTuvaluUgandaUkraineUnited Arab EmiratesUnited KingdomUnited StatesUpper middle incomeUruguayVanuatuVenezuela, RBVietnamVirgin Islands (U.S.)WorldYemen, Rep.ZambiaZimbabwe Timeline:
This timeline shows a graph from 1966 to 2016 of Nicaragua. No data until 1965. Number of actual observations by date: 50.
Source name:
World Development Indicators
Source organization:
World Bank staff estimates from the Comtrade database maintained by the United Nations Statistics Division.
Categories, topics:
Agriculture & Rural Development, Private Sector, Trade
Last updated:
apr 23, 2017
Indicators value changes by year
Maximum:
50.219
jan 1, 1966
At the date of observation
Value
Absolute change
Change from previous value
jan 1, 1966
50.219
+50.219
0.0%
jan 1, 1967
44.749
-5.471
-10.89%
jan 1, 1968
41.522
-3.226
-7.21%
jan 1, 1969
40.718
-0.804
-1.94%
jan 1, 1970
32.427
-8.291
-20.36%
jan 1, 1971
23.765
-8.662
-26.71%
jan 1, 1972
26.989
+3.224
13.56%
jan 1, 1973
30.174
+3.186
11.8%
jan 1, 1974
27.963
-2.212
-7.33%
jan 1, 1975
40.466
+12.503
44.71%
jan 1, 1976
29.496
-10.97
-27.11%
jan 1, 1977
27.59
-1.906
-6.46%
jan 1, 1978
26.118
-1.473
-5.34%
jan 1, 1979
24.692
-1.426
-5.46%
jan 1, 1980
26.193
+1.501
6.08%
jan 1, 1981
8.128
-18.065
-68.97%
jan 1, 1982
26.238
+18.109
222.8%
jan 1, 1983
23.183
-3.054
-11.64%
jan 1, 1984
26.639
+3.456
14.91%
jan 1, 1985
35.639
+9.0
33.78%
jan 1, 1986
33.776
-1.862
-5.23%
jan 1, 1987
19.611
-14.165
-41.94%
jan 1, 1989
22.671
+3.059
15.6%
jan 1, 1990
12.189
-10.482
-46.24%
jan 1, 1991
13.68
+1.492
12.24%
jan 1, 1992
19.562
+5.882
43.0%
jan 1, 1993
13.238
-6.324
-32.33%
jan 1, 1994
1.953
-11.285
-85.24%
jan 1, 1995
3.578
+1.624
83.14%
jan 1, 1996
2.999
-0.578
-16.17%
jan 1, 1997
4.658
+1.659
55.31%
jan 1, 1998
3.732
-0.926
-19.88%
jan 1, 1999
2.698
-1.034
-27.7%
jan 1, 2000
2.235
-0.463
-17.17%
jan 1, 2001
2.123
-0.112
-5.0%
jan 1, 2002
2.829
+0.706
33.26%
jan 1, 2003
3.692
+0.863
30.49%
jan 1, 2004
2.165
-1.527
-41.36%
jan 1, 2005
1.925
-0.24
-11.09%
jan 1, 2006
2.256
+0.331
17.19%
jan 1, 2007
1.79
-0.466
-20.64%
jan 1, 2008
1.231
-0.559
-31.22%
jan 1, 2009
0.581
-0.65
-52.81%
jan 1, 2010
0.882
+0.301
51.75%
jan 1, 2011
1.229
+0.348
39.42%
jan 1, 2012
1.608
+0.379
30.79%
jan 1, 2013
0.824
-0.784
-48.77%
jan 1, 2014
0.724
-0.099
-12.06%
jan 1, 2015
0.964
+0.24
33.1%
jan 1, 2016
0.92
-0.044
-4.54%
Ranking of countries by current statistics by years


Comments: