29
/
en
AIzaSyAYiBZKx7MnpbEhh9jyipgxe19OcubqV5w
April 1, 2024
182735
Macao SAR, China
MAC
true
2
1
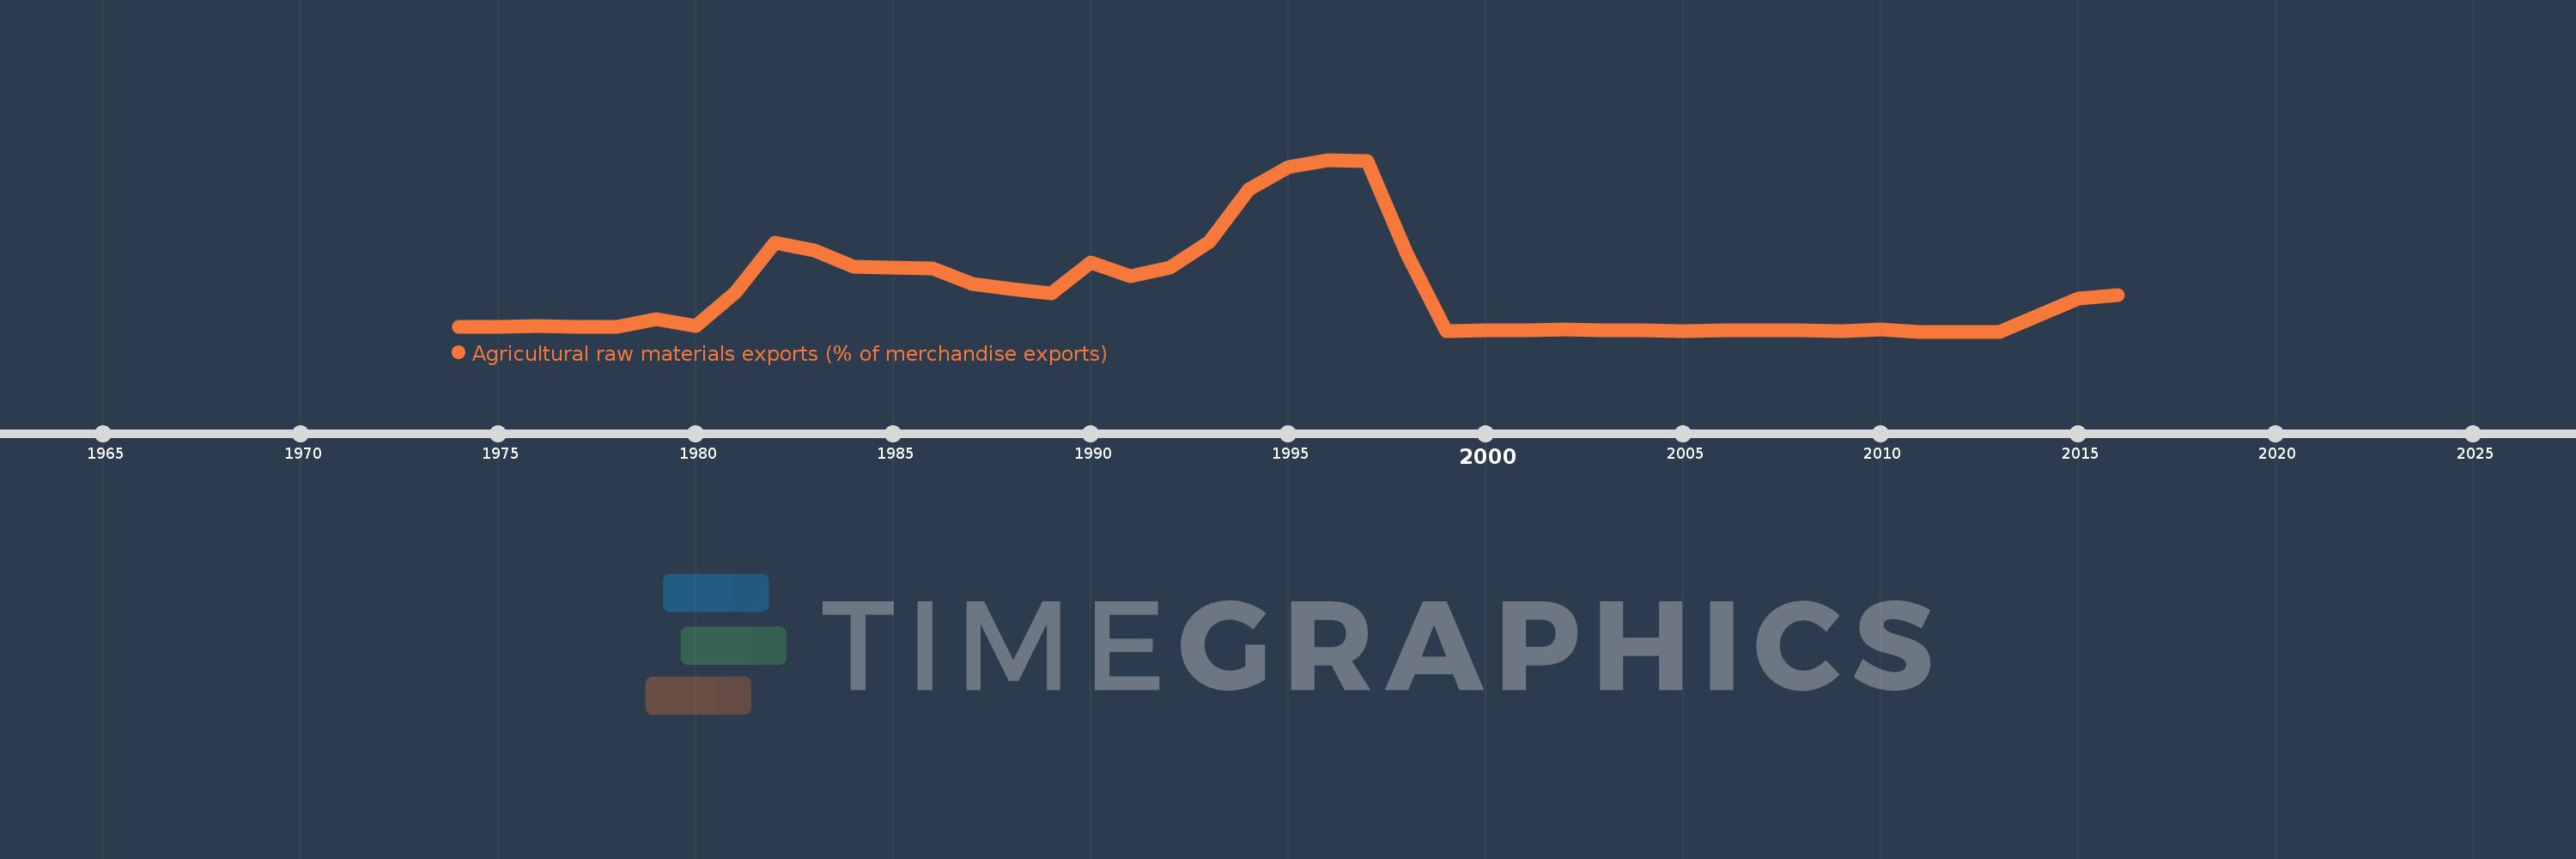
Agricultural raw materials exports (% of merchandise exports)
2016,2015,2013,2012,2011,2010,2009,2008,2007,2006,2005,2004,2003,2002,2001,2000,1999,1998,1997,1996,1995,1994,1993,1992,1991,1990,1989,1988,1987,1986,1985,1984,1983,1982,1981,1980,1979,1978,1977,1976,1975,1974
This statistics in other country:
AfghanistanAlbaniaAlgeriaAndorraAngolaAntigua and BarbudaArab WorldArgentinaArmeniaArubaAustraliaAustriaAzerbaijanBahamas, TheBahrainBangladeshBarbadosBelarusBelgiumBelizeBeninBermudaBhutanBoliviaBosnia and HerzegovinaBotswanaBrazilBrunei DarussalamBulgariaBurkina FasoBurundiCabo VerdeCambodiaCameroonCanadaCaribbean small statesCayman IslandsCentral African RepublicCentral Europe and the BalticsChadChileChinaColombiaComorosCongo, Dem. Rep.Congo, Rep.Costa RicaCote d'IvoireCroatiaCubaCyprusCzech RepublicDenmarkDjiboutiDominicaDominican RepublicEarly-demographic dividendEast Asia & PacificEast Asia & Pacific (excluding high income)East Asia & Pacific (IDA & IBRD countries)EcuadorEgypt, Arab Rep.El SalvadorEquatorial GuineaEritreaEstoniaEthiopiaEuro areaEurope & Central AsiaEurope & Central Asia (excluding high income)Europe & Central Asia (IDA & IBRD countries)European UnionFaroe IslandsFijiFinlandFragile and conflict affected situationsFranceFrench PolynesiaGabonGambia, TheGeorgiaGermanyGhanaGreeceGreenlandGrenadaGuatemalaGuineaGuinea-BissauGuyanaHaitiHeavily indebted poor countries (HIPC)High incomeHondurasHong Kong SAR, ChinaHungaryIBRD onlyIcelandIDA & IBRD totalIDA blendIDA onlyIDA totalIndiaIndonesiaIran, Islamic Rep.IraqIrelandIsraelItalyJamaicaJapanJordanKazakhstanKenyaKiribatiKorea, Rep.KuwaitKyrgyz RepublicLao PDRLate-demographic dividendLatin America & Caribbean Latin America & Caribbean (excluding high income)Latin America & the Caribbean (IDA & IBRD countries)LatviaLeast developed countries: UN classificationLebanonLesothoLiberiaLibyaLithuaniaLow & middle incomeLower middle incomeLuxembourgMacao SAR, ChinaMacedonia, FYRMadagascarMalawiMalaysiaMaldivesMaliMaltaMauritaniaMauritiusMexicoMiddle East & North AfricaMiddle East & North Africa (excluding high income)Middle East & North Africa (IDA & IBRD countries)Middle incomeMoldovaMongoliaMoroccoMozambiqueMyanmarNamibiaNepalNetherlandsNew CaledoniaNew ZealandNicaraguaNigerNigeriaNorth AmericaNorwayOECD membersOmanOther small statesPacific island small statesPakistanPalauPanamaPapua New GuineaParaguayPeruPhilippinesPolandPortugalPost-demographic dividendPre-demographic dividendQatarRomaniaRussian FederationRwandaSamoaSao Tome and PrincipeSaudi ArabiaSenegalSerbiaSeychellesSierra LeoneSingaporeSlovak RepublicSloveniaSmall statesSolomon IslandsSomaliaSouth AfricaSouth AsiaSouth Asia (IDA & IBRD)SpainSri LankaSt. Kitts and NevisSt. LuciaSt. Vincent and the GrenadinesSub-Saharan Africa Sub-Saharan Africa (excluding high income)Sub-Saharan Africa (IDA & IBRD countries)SudanSurinameSwazilandSwedenSwitzerlandSyrian Arab RepublicTajikistanTanzaniaThailandTimor-LesteTogoTongaTrinidad and TobagoTunisiaTurkeyTurkmenistanTurks and Caicos IslandsTuvaluUgandaUkraineUnited Arab EmiratesUnited KingdomUnited StatesUpper middle incomeUruguayVanuatuVenezuela, RBVietnamVirgin Islands (U.S.)WorldYemen, Rep.ZambiaZimbabwe Timeline:
This timeline shows a graph from 1974 to 2016 of Macao SAR, China. No data until 1973. Number of actual observations by date: 42.
Source name:
World Development Indicators
Source organization:
World Bank staff estimates from the Comtrade database maintained by the United Nations Statistics Division.
Categories, topics:
Agriculture & Rural Development, Private Sector, Trade
Last updated:
apr 23, 2017
Indicators value changes by year
At the date of observation
Value
Absolute change
Change from previous value
jan 1, 1974
0.064
+0.064
0.0%
jan 1, 1975
0.071
+0.007
10.57%
jan 1, 1976
0.083
+0.012
16.67%
jan 1, 1977
0.064
-0.019
-23.29%
jan 1, 1978
0.071
+0.007
11.37%
jan 1, 1979
0.18
+0.109
154.15%
jan 1, 1980
0.078
-0.103
-56.91%
jan 1, 1981
0.554
+0.476
612.49%
jan 1, 1982
1.251
+0.698
125.95%
jan 1, 1983
1.139
-0.113
-9.01%
jan 1, 1984
0.909
-0.229
-20.14%
jan 1, 1985
0.892
-0.017
-1.86%
jan 1, 1986
0.889
-0.004
-0.4%
jan 1, 1987
0.671
-0.218
-24.51%
jan 1, 1988
0.601
-0.07
-10.47%
jan 1, 1989
0.534
-0.067
-11.16%
jan 1, 1990
0.969
+0.436
81.63%
jan 1, 1991
0.773
-0.197
-20.3%
jan 1, 1992
0.901
+0.128
16.58%
jan 1, 1993
1.265
+0.364
40.43%
jan 1, 1994
1.999
+0.735
58.09%
jan 1, 1995
2.312
+0.312
15.62%
jan 1, 1996
2.41
+0.098
4.23%
jan 1, 1997
2.395
-0.015
-0.62%
jan 1, 1998
1.093
-1.302
-54.36%
jan 1, 1999
0.012
-1.081
-98.89%
jan 1, 2000
0.017
+0.005
38.86%
jan 1, 2001
0.018
+0.002
9.65%
jan 1, 2002
0.027
+0.009
46.81%
jan 1, 2003
0.018
-0.009
-32.94%
jan 1, 2004
0.015
-0.003
-19.04%
jan 1, 2005
0.01
-0.005
-33.45%
jan 1, 2006
0.015
+0.005
51.57%
jan 1, 2007
0.014
-0.001
-7.83%
jan 1, 2008
0.013
-0.001
-6.44%
jan 1, 2009
0.011
-0.002
-13.48%
jan 1, 2010
0.025
+0.014
129.1%
jan 1, 2011
0.0
-0.025
-100.0%
jan 1, 2015
0.469
+0.469
%
jan 1, 2016
0.516
+0.047
10.13%
Ranking of countries by current statistics by years


Comments: