29
/
en
AIzaSyAYiBZKx7MnpbEhh9jyipgxe19OcubqV5w
April 1, 2024
57858
South Asia (IDA & IBRD)
TSA
false
2
1
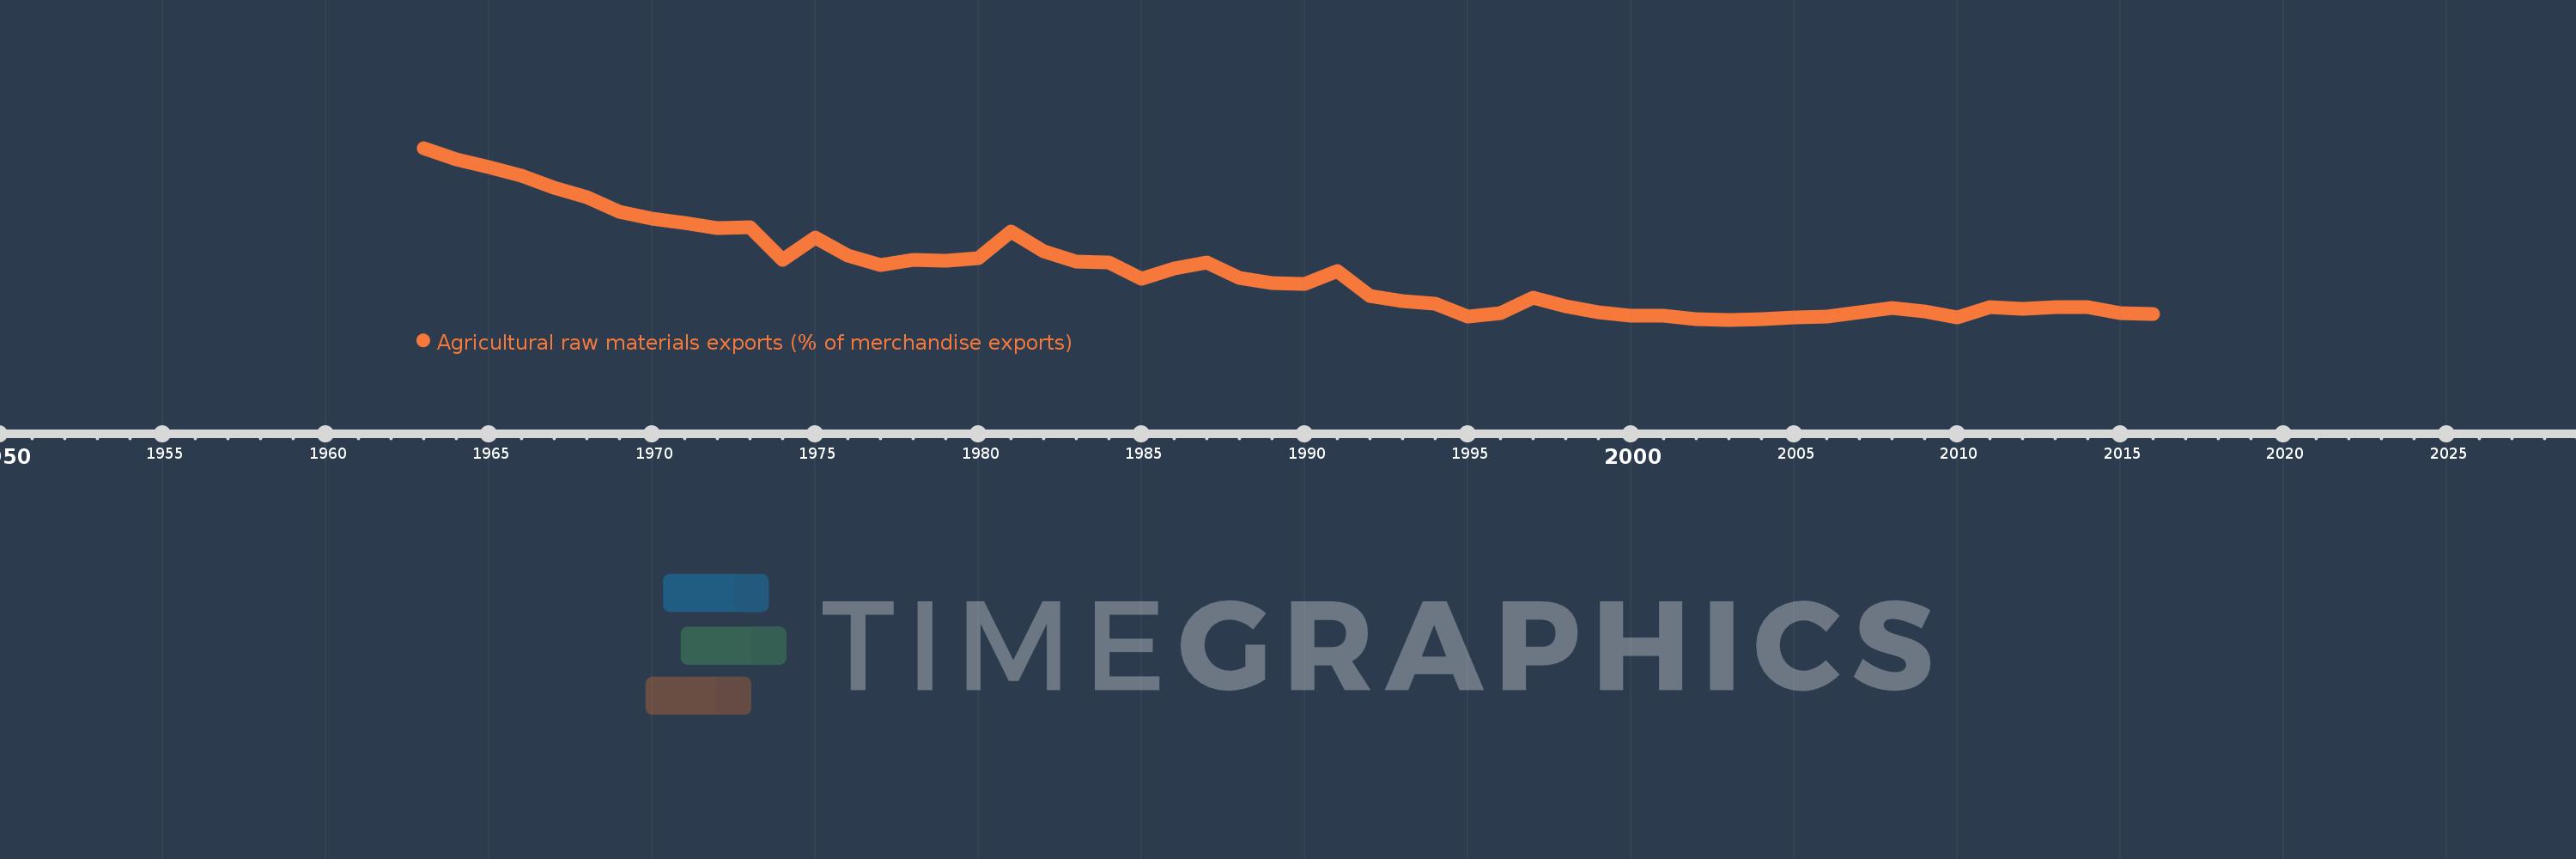
Agricultural raw materials exports (% of merchandise exports)
2016,2015,2014,2013,2012,2011,2010,2009,2008,2007,2006,2005,2004,2003,2002,2001,2000,1999,1998,1997,1996,1995,1994,1993,1992,1991,1990,1989,1988,1987,1986,1985,1984,1983,1982,1981,1980,1979,1978,1977,1976,1975,1974,1973,1972,1971,1970,1969,1968,1967,1966,1965,1964,1963
This statistics in other country:
AfghanistanAlbaniaAlgeriaAndorraAngolaAntigua and BarbudaArab WorldArgentinaArmeniaArubaAustraliaAustriaAzerbaijanBahamas, TheBahrainBangladeshBarbadosBelarusBelgiumBelizeBeninBermudaBhutanBoliviaBosnia and HerzegovinaBotswanaBrazilBrunei DarussalamBulgariaBurkina FasoBurundiCabo VerdeCambodiaCameroonCanadaCaribbean small statesCayman IslandsCentral African RepublicCentral Europe and the BalticsChadChileChinaColombiaComorosCongo, Dem. Rep.Congo, Rep.Costa RicaCote d'IvoireCroatiaCubaCyprusCzech RepublicDenmarkDjiboutiDominicaDominican RepublicEarly-demographic dividendEast Asia & PacificEast Asia & Pacific (excluding high income)East Asia & Pacific (IDA & IBRD countries)EcuadorEgypt, Arab Rep.El SalvadorEquatorial GuineaEritreaEstoniaEthiopiaEuro areaEurope & Central AsiaEurope & Central Asia (excluding high income)Europe & Central Asia (IDA & IBRD countries)European UnionFaroe IslandsFijiFinlandFragile and conflict affected situationsFranceFrench PolynesiaGabonGambia, TheGeorgiaGermanyGhanaGreeceGreenlandGrenadaGuatemalaGuineaGuinea-BissauGuyanaHaitiHeavily indebted poor countries (HIPC)High incomeHondurasHong Kong SAR, ChinaHungaryIBRD onlyIcelandIDA & IBRD totalIDA blendIDA onlyIDA totalIndiaIndonesiaIran, Islamic Rep.IraqIrelandIsraelItalyJamaicaJapanJordanKazakhstanKenyaKiribatiKorea, Rep.KuwaitKyrgyz RepublicLao PDRLate-demographic dividendLatin America & Caribbean Latin America & Caribbean (excluding high income)Latin America & the Caribbean (IDA & IBRD countries)LatviaLeast developed countries: UN classificationLebanonLesothoLiberiaLibyaLithuaniaLow & middle incomeLower middle incomeLuxembourgMacao SAR, ChinaMacedonia, FYRMadagascarMalawiMalaysiaMaldivesMaliMaltaMauritaniaMauritiusMexicoMiddle East & North AfricaMiddle East & North Africa (excluding high income)Middle East & North Africa (IDA & IBRD countries)Middle incomeMoldovaMongoliaMoroccoMozambiqueMyanmarNamibiaNepalNetherlandsNew CaledoniaNew ZealandNicaraguaNigerNigeriaNorth AmericaNorwayOECD membersOmanOther small statesPacific island small statesPakistanPalauPanamaPapua New GuineaParaguayPeruPhilippinesPolandPortugalPost-demographic dividendPre-demographic dividendQatarRomaniaRussian FederationRwandaSamoaSao Tome and PrincipeSaudi ArabiaSenegalSerbiaSeychellesSierra LeoneSingaporeSlovak RepublicSloveniaSmall statesSolomon IslandsSomaliaSouth AfricaSouth AsiaSouth Asia (IDA & IBRD)SpainSri LankaSt. Kitts and NevisSt. LuciaSt. Vincent and the GrenadinesSub-Saharan Africa Sub-Saharan Africa (excluding high income)Sub-Saharan Africa (IDA & IBRD countries)SudanSurinameSwazilandSwedenSwitzerlandSyrian Arab RepublicTajikistanTanzaniaThailandTimor-LesteTogoTongaTrinidad and TobagoTunisiaTurkeyTurkmenistanTurks and Caicos IslandsTuvaluUgandaUkraineUnited Arab EmiratesUnited KingdomUnited StatesUpper middle incomeUruguayVanuatuVenezuela, RBVietnamVirgin Islands (U.S.)WorldYemen, Rep.ZambiaZimbabwe Timeline:
This timeline shows a graph from 1963 to 2016 of South Asia (IDA & IBRD). No data until 1962. Number of actual observations by date: 54.
Source name:
World Development Indicators
Source organization:
World Bank staff estimates from the Comtrade database maintained by the United Nations Statistics Division.
Categories, topics:
Agriculture & Rural Development, Private Sector, Trade
Last updated:
apr 23, 2017
Indicators value changes by year
Maximum:
13.957
jan 1, 1963
At the date of observation
Value
Absolute change
Change from previous value
jan 1, 1963
13.957
+13.957
0.0%
jan 1, 1964
13.105
-0.852
-6.1%
jan 1, 1965
12.502
-0.604
-4.61%
jan 1, 1966
11.9
-0.601
-4.81%
jan 1, 1967
10.965
-0.936
-7.86%
jan 1, 1968
10.289
-0.676
-6.17%
jan 1, 1969
9.207
-1.082
-10.52%
jan 1, 1970
8.686
-0.521
-5.65%
jan 1, 1971
8.32
-0.366
-4.21%
jan 1, 1972
7.95
-0.37
-4.44%
jan 1, 1973
8.019
+0.069
0.86%
jan 1, 1974
5.57
-2.449
-30.54%
jan 1, 1975
7.258
+1.688
30.3%
jan 1, 1976
5.889
-1.369
-18.86%
jan 1, 1977
5.208
-0.681
-11.56%
jan 1, 1978
5.594
+0.386
7.4%
jan 1, 1979
5.54
-0.054
-0.97%
jan 1, 1980
5.714
+0.174
3.15%
jan 1, 1981
7.69
+1.976
34.58%
jan 1, 1982
6.211
-1.479
-19.24%
jan 1, 1983
5.489
-0.721
-11.62%
jan 1, 1984
5.386
-0.103
-1.88%
jan 1, 1985
4.157
-1.229
-22.81%
jan 1, 1986
4.963
+0.806
19.38%
jan 1, 1987
5.416
+0.453
9.13%
jan 1, 1988
4.218
-1.198
-22.12%
jan 1, 1989
3.842
-0.376
-8.92%
jan 1, 1990
3.802
-0.04
-1.04%
jan 1, 1991
4.771
+0.969
25.5%
jan 1, 1992
2.861
-1.91
-40.04%
jan 1, 1993
2.529
-0.332
-11.62%
jan 1, 1994
2.303
-0.226
-8.94%
jan 1, 1995
1.347
-0.956
-41.51%
jan 1, 1996
1.595
+0.248
18.42%
jan 1, 1997
2.781
+1.186
74.39%
jan 1, 1998
2.101
-0.68
-24.45%
jan 1, 1999
1.678
-0.423
-20.14%
jan 1, 2000
1.433
-0.245
-14.61%
jan 1, 2001
1.41
-0.023
-1.63%
jan 1, 2002
1.187
-0.223
-15.8%
jan 1, 2003
1.111
-0.076
-6.43%
jan 1, 2004
1.138
+0.028
2.49%
jan 1, 2005
1.293
+0.154
13.56%
jan 1, 2006
1.338
+0.045
3.49%
jan 1, 2007
1.7
+0.363
27.11%
jan 1, 2008
2.007
+0.307
18.03%
jan 1, 2009
1.722
-0.285
-14.21%
jan 1, 2010
1.309
-0.412
-23.96%
jan 1, 2011
2.061
+0.751
57.4%
jan 1, 2012
1.942
-0.119
-5.76%
jan 1, 2013
2.041
+0.099
5.1%
jan 1, 2014
2.059
+0.018
0.89%
jan 1, 2015
1.62
-0.439
-21.31%
jan 1, 2016
1.561
-0.06
-3.68%
Ranking of countries by current statistics by years


Comments: