29
/
en
AIzaSyAYiBZKx7MnpbEhh9jyipgxe19OcubqV5w
April 1, 2024
231948
Samoa
WSM
true
2
1
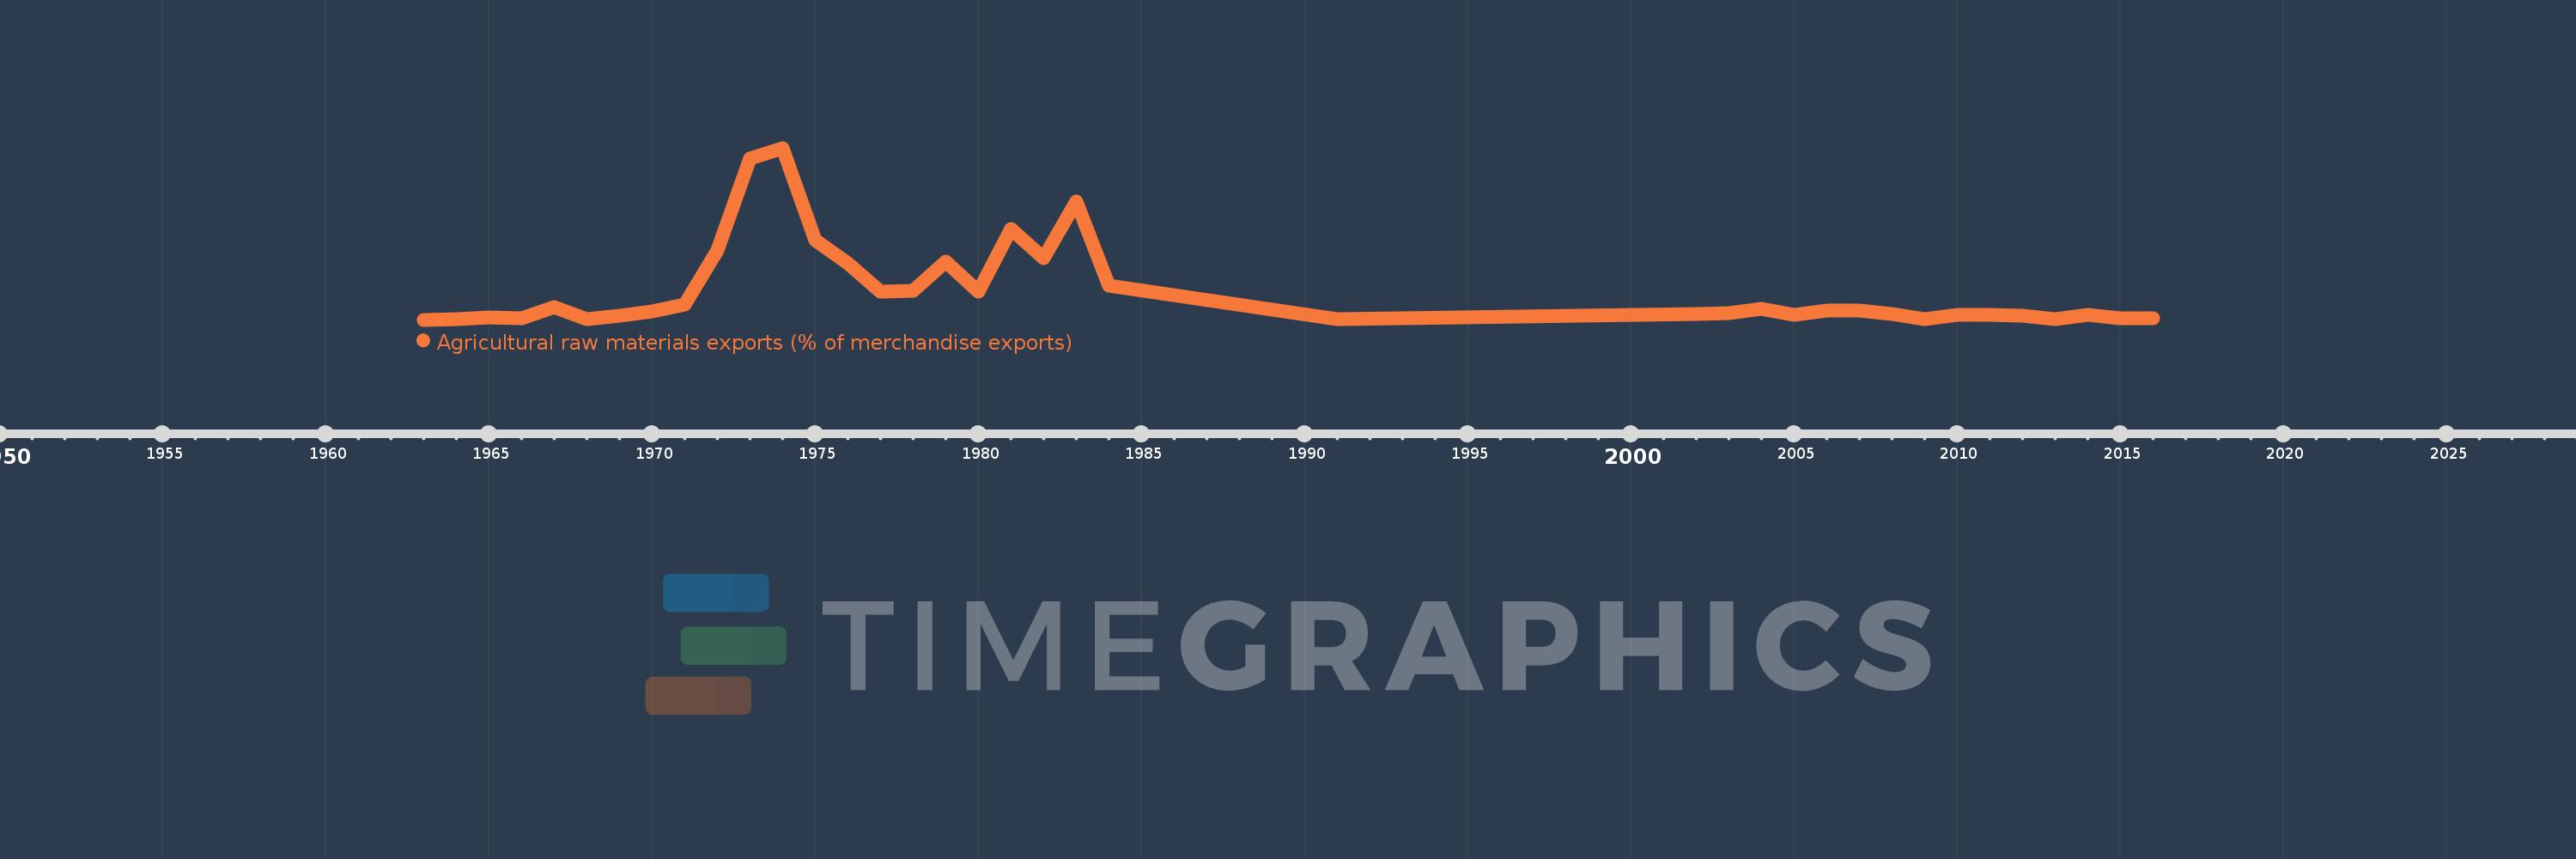
Agricultural raw materials exports (% of merchandise exports)
2016,2015,2014,2013,2012,2011,2010,2009,2008,2007,2006,2005,2004,2003,2002,1991,1984,1983,1982,1981,1980,1979,1978,1977,1976,1975,1974,1973,1972,1971,1970,1969,1968,1967,1966,1965,1964,1963
This statistics in other country:
AfghanistanAlbaniaAlgeriaAndorraAngolaAntigua and BarbudaArab WorldArgentinaArmeniaArubaAustraliaAustriaAzerbaijanBahamas, TheBahrainBangladeshBarbadosBelarusBelgiumBelizeBeninBermudaBhutanBoliviaBosnia and HerzegovinaBotswanaBrazilBrunei DarussalamBulgariaBurkina FasoBurundiCabo VerdeCambodiaCameroonCanadaCaribbean small statesCayman IslandsCentral African RepublicCentral Europe and the BalticsChadChileChinaColombiaComorosCongo, Dem. Rep.Congo, Rep.Costa RicaCote d'IvoireCroatiaCubaCyprusCzech RepublicDenmarkDjiboutiDominicaDominican RepublicEarly-demographic dividendEast Asia & PacificEast Asia & Pacific (excluding high income)East Asia & Pacific (IDA & IBRD countries)EcuadorEgypt, Arab Rep.El SalvadorEquatorial GuineaEritreaEstoniaEthiopiaEuro areaEurope & Central AsiaEurope & Central Asia (excluding high income)Europe & Central Asia (IDA & IBRD countries)European UnionFaroe IslandsFijiFinlandFragile and conflict affected situationsFranceFrench PolynesiaGabonGambia, TheGeorgiaGermanyGhanaGreeceGreenlandGrenadaGuatemalaGuineaGuinea-BissauGuyanaHaitiHeavily indebted poor countries (HIPC)High incomeHondurasHong Kong SAR, ChinaHungaryIBRD onlyIcelandIDA & IBRD totalIDA blendIDA onlyIDA totalIndiaIndonesiaIran, Islamic Rep.IraqIrelandIsraelItalyJamaicaJapanJordanKazakhstanKenyaKiribatiKorea, Rep.KuwaitKyrgyz RepublicLao PDRLate-demographic dividendLatin America & Caribbean Latin America & Caribbean (excluding high income)Latin America & the Caribbean (IDA & IBRD countries)LatviaLeast developed countries: UN classificationLebanonLesothoLiberiaLibyaLithuaniaLow & middle incomeLower middle incomeLuxembourgMacao SAR, ChinaMacedonia, FYRMadagascarMalawiMalaysiaMaldivesMaliMaltaMauritaniaMauritiusMexicoMiddle East & North AfricaMiddle East & North Africa (excluding high income)Middle East & North Africa (IDA & IBRD countries)Middle incomeMoldovaMongoliaMoroccoMozambiqueMyanmarNamibiaNepalNetherlandsNew CaledoniaNew ZealandNicaraguaNigerNigeriaNorth AmericaNorwayOECD membersOmanOther small statesPacific island small statesPakistanPalauPanamaPapua New GuineaParaguayPeruPhilippinesPolandPortugalPost-demographic dividendPre-demographic dividendQatarRomaniaRussian FederationRwandaSamoaSao Tome and PrincipeSaudi ArabiaSenegalSerbiaSeychellesSierra LeoneSingaporeSlovak RepublicSloveniaSmall statesSolomon IslandsSomaliaSouth AfricaSouth AsiaSouth Asia (IDA & IBRD)SpainSri LankaSt. Kitts and NevisSt. LuciaSt. Vincent and the GrenadinesSub-Saharan Africa Sub-Saharan Africa (excluding high income)Sub-Saharan Africa (IDA & IBRD countries)SudanSurinameSwazilandSwedenSwitzerlandSyrian Arab RepublicTajikistanTanzaniaThailandTimor-LesteTogoTongaTrinidad and TobagoTunisiaTurkeyTurkmenistanTurks and Caicos IslandsTuvaluUgandaUkraineUnited Arab EmiratesUnited KingdomUnited StatesUpper middle incomeUruguayVanuatuVenezuela, RBVietnamVirgin Islands (U.S.)WorldYemen, Rep.ZambiaZimbabwe Timeline:
This timeline shows a graph from 1963 to 2016 of Samoa. No data until 1962. Number of actual observations by date: 38.
Source name:
World Development Indicators
Source organization:
World Bank staff estimates from the Comtrade database maintained by the United Nations Statistics Division.
Categories, topics:
Agriculture & Rural Development, Private Sector, Trade
Last updated:
apr 23, 2017
Indicators value changes by year
Maximum:
11.085
jan 1, 1974
At the date of observation
Value
Absolute change
Change from previous value
jan 1, 1963
0.085
+0.085
0.0%
jan 1, 1964
0.099
+0.013
15.54%
jan 1, 1965
0.214
+0.116
117.15%
jan 1, 1966
0.194
-0.02
-9.35%
jan 1, 1967
0.883
+0.688
354.24%
jan 1, 1968
0.115
-0.768
-86.96%
jan 1, 1969
0.36
+0.245
213.04%
jan 1, 1970
0.646
+0.285
79.12%
jan 1, 1971
1.044
+0.398
61.67%
jan 1, 1972
4.501
+3.457
331.19%
jan 1, 1973
10.431
+5.93
131.76%
jan 1, 1974
11.085
+0.654
6.27%
jan 1, 1975
5.161
-5.924
-53.44%
jan 1, 1976
3.713
-1.448
-28.05%
jan 1, 1977
1.894
-1.819
-48.98%
jan 1, 1978
1.924
+0.029
1.54%
jan 1, 1979
3.823
+1.899
98.72%
jan 1, 1980
1.902
-1.921
-50.25%
jan 1, 1981
5.886
+3.984
209.48%
jan 1, 1982
4.032
-1.853
-31.49%
jan 1, 1983
7.638
+3.606
89.43%
jan 1, 1984
2.265
-5.373
-70.35%
jan 1, 1991
0.113
-2.152
-95.0%
jan 1, 2002
0.447
+0.334
294.69%
jan 1, 2003
0.52
+0.073
16.37%
jan 1, 2004
0.787
+0.267
51.4%
jan 1, 2005
0.374
-0.414
-52.52%
jan 1, 2006
0.695
+0.321
85.76%
jan 1, 2007
0.688
-0.006
-0.93%
jan 1, 2008
0.448
-0.241
-34.96%
jan 1, 2009
0.139
-0.308
-68.91%
jan 1, 2010
0.375
+0.236
169.7%
jan 1, 2011
0.421
+0.045
12.11%
jan 1, 2012
0.339
-0.081
-19.35%
jan 1, 2013
0.127
-0.213
-62.64%
jan 1, 2014
0.391
+0.264
208.3%
jan 1, 2015
0.158
-0.233
-59.68%
jan 1, 2016
0.192
+0.034
21.66%
Ranking of countries by current statistics by years


Comments: