29
/
en
AIzaSyAYiBZKx7MnpbEhh9jyipgxe19OcubqV5w
April 1, 2024
261856
Thailand
THA
true
2
1
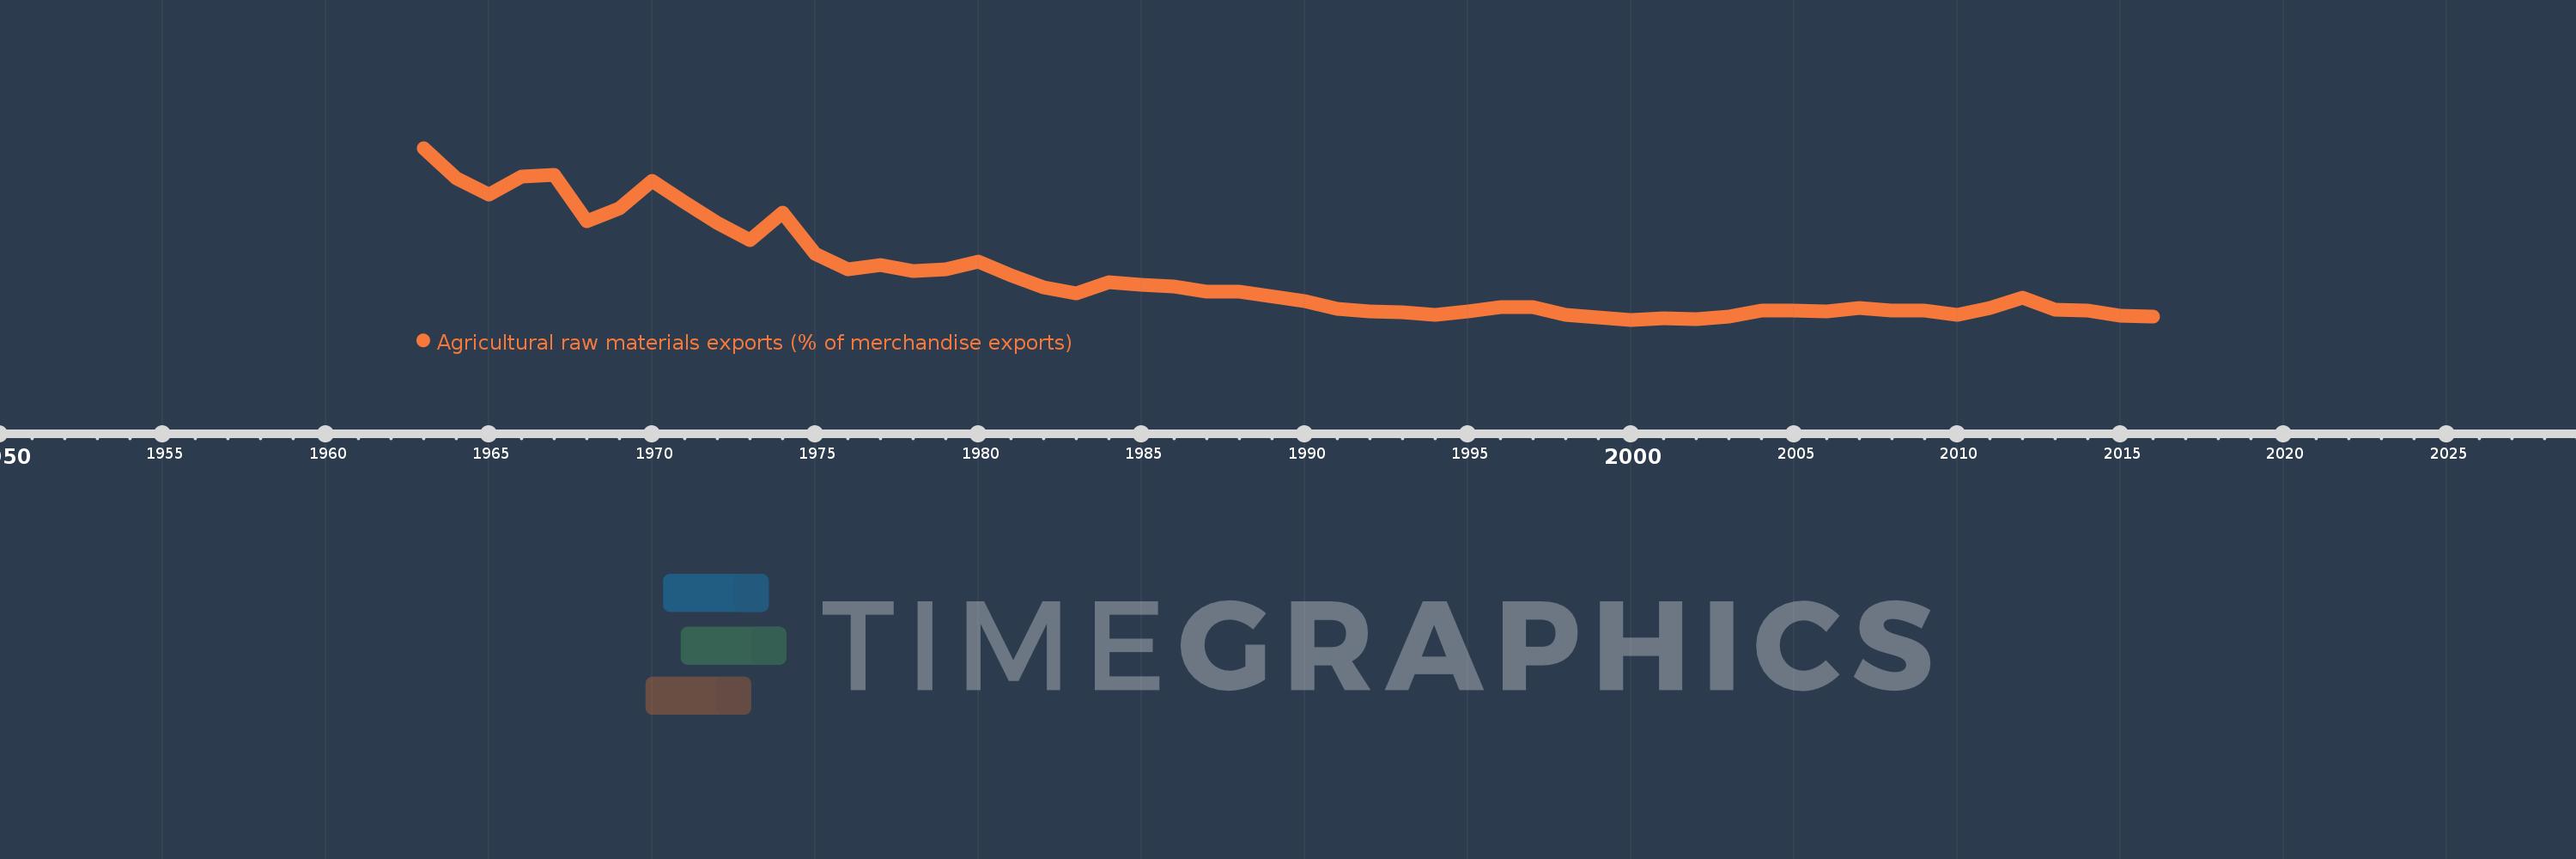
Agricultural raw materials exports (% of merchandise exports)
2016,2015,2014,2013,2012,2011,2010,2009,2008,2007,2006,2005,2004,2003,2002,2001,2000,1999,1998,1997,1996,1995,1994,1993,1992,1991,1990,1988,1987,1986,1985,1984,1983,1982,1981,1980,1979,1978,1977,1976,1975,1974,1973,1972,1971,1970,1969,1968,1967,1966,1965,1964,1963
This statistics in other country:
AfghanistanAlbaniaAlgeriaAndorraAngolaAntigua and BarbudaArab WorldArgentinaArmeniaArubaAustraliaAustriaAzerbaijanBahamas, TheBahrainBangladeshBarbadosBelarusBelgiumBelizeBeninBermudaBhutanBoliviaBosnia and HerzegovinaBotswanaBrazilBrunei DarussalamBulgariaBurkina FasoBurundiCabo VerdeCambodiaCameroonCanadaCaribbean small statesCayman IslandsCentral African RepublicCentral Europe and the BalticsChadChileChinaColombiaComorosCongo, Dem. Rep.Congo, Rep.Costa RicaCote d'IvoireCroatiaCubaCyprusCzech RepublicDenmarkDjiboutiDominicaDominican RepublicEarly-demographic dividendEast Asia & PacificEast Asia & Pacific (excluding high income)East Asia & Pacific (IDA & IBRD countries)EcuadorEgypt, Arab Rep.El SalvadorEquatorial GuineaEritreaEstoniaEthiopiaEuro areaEurope & Central AsiaEurope & Central Asia (excluding high income)Europe & Central Asia (IDA & IBRD countries)European UnionFaroe IslandsFijiFinlandFragile and conflict affected situationsFranceFrench PolynesiaGabonGambia, TheGeorgiaGermanyGhanaGreeceGreenlandGrenadaGuatemalaGuineaGuinea-BissauGuyanaHaitiHeavily indebted poor countries (HIPC)High incomeHondurasHong Kong SAR, ChinaHungaryIBRD onlyIcelandIDA & IBRD totalIDA blendIDA onlyIDA totalIndiaIndonesiaIran, Islamic Rep.IraqIrelandIsraelItalyJamaicaJapanJordanKazakhstanKenyaKiribatiKorea, Rep.KuwaitKyrgyz RepublicLao PDRLate-demographic dividendLatin America & Caribbean Latin America & Caribbean (excluding high income)Latin America & the Caribbean (IDA & IBRD countries)LatviaLeast developed countries: UN classificationLebanonLesothoLiberiaLibyaLithuaniaLow & middle incomeLower middle incomeLuxembourgMacao SAR, ChinaMacedonia, FYRMadagascarMalawiMalaysiaMaldivesMaliMaltaMauritaniaMauritiusMexicoMiddle East & North AfricaMiddle East & North Africa (excluding high income)Middle East & North Africa (IDA & IBRD countries)Middle incomeMoldovaMongoliaMoroccoMozambiqueMyanmarNamibiaNepalNetherlandsNew CaledoniaNew ZealandNicaraguaNigerNigeriaNorth AmericaNorwayOECD membersOmanOther small statesPacific island small statesPakistanPalauPanamaPapua New GuineaParaguayPeruPhilippinesPolandPortugalPost-demographic dividendPre-demographic dividendQatarRomaniaRussian FederationRwandaSamoaSao Tome and PrincipeSaudi ArabiaSenegalSerbiaSeychellesSierra LeoneSingaporeSlovak RepublicSloveniaSmall statesSolomon IslandsSomaliaSouth AfricaSouth AsiaSouth Asia (IDA & IBRD)SpainSri LankaSt. Kitts and NevisSt. LuciaSt. Vincent and the GrenadinesSub-Saharan Africa Sub-Saharan Africa (excluding high income)Sub-Saharan Africa (IDA & IBRD countries)SudanSurinameSwazilandSwedenSwitzerlandSyrian Arab RepublicTajikistanTanzaniaThailandTimor-LesteTogoTongaTrinidad and TobagoTunisiaTurkeyTurkmenistanTurks and Caicos IslandsTuvaluUgandaUkraineUnited Arab EmiratesUnited KingdomUnited StatesUpper middle incomeUruguayVanuatuVenezuela, RBVietnamVirgin Islands (U.S.)WorldYemen, Rep.ZambiaZimbabwe Timeline:
This timeline shows a graph from 1963 to 2016 of Thailand. No data until 1962. Number of actual observations by date: 53.
Source name:
World Development Indicators
Source organization:
World Bank staff estimates from the Comtrade database maintained by the United Nations Statistics Division.
Categories, topics:
Agriculture & Rural Development, Private Sector, Trade
Last updated:
apr 23, 2017
Indicators value changes by year
Maximum:
34.886
jan 1, 1963
At the date of observation
Value
Absolute change
Change from previous value
jan 1, 1963
34.886
+34.886
0.0%
jan 1, 1964
29.313
-5.573
-15.97%
jan 1, 1965
26.228
-3.085
-10.52%
jan 1, 1966
29.509
+3.281
12.51%
jan 1, 1967
29.873
+0.364
1.23%
jan 1, 1968
21.283
-8.59
-28.76%
jan 1, 1969
23.647
+2.365
11.11%
jan 1, 1970
28.799
+5.151
21.78%
jan 1, 1971
24.74
-4.059
-14.09%
jan 1, 1972
20.996
-3.744
-15.13%
jan 1, 1973
17.79
-3.207
-15.27%
jan 1, 1974
22.948
+5.158
29.0%
jan 1, 1975
15.274
-7.674
-33.44%
jan 1, 1976
12.341
-2.933
-19.2%
jan 1, 1977
13.2
+0.859
6.96%
jan 1, 1978
12.091
-1.109
-8.4%
jan 1, 1979
12.421
+0.33
2.73%
jan 1, 1980
13.798
+1.377
11.09%
jan 1, 1981
11.237
-2.561
-18.56%
jan 1, 1982
8.98
-2.257
-20.09%
jan 1, 1983
7.993
-0.988
-11.0%
jan 1, 1984
10.002
+2.01
25.14%
jan 1, 1985
9.517
-0.485
-4.85%
jan 1, 1986
9.229
-0.289
-3.03%
jan 1, 1987
8.213
-1.015
-11.0%
jan 1, 1988
8.198
-0.016
-0.19%
jan 1, 1990
6.405
-1.793
-21.87%
jan 1, 1991
5.077
-1.327
-20.73%
jan 1, 1992
4.519
-0.558
-10.99%
jan 1, 1993
4.464
-0.056
-1.24%
jan 1, 1994
3.969
-0.494
-11.08%
jan 1, 1995
4.568
+0.599
15.09%
jan 1, 1996
5.371
+0.803
17.57%
jan 1, 1997
5.361
-0.009
-0.17%
jan 1, 1998
4.007
-1.355
-25.27%
jan 1, 1999
3.408
-0.599
-14.95%
jan 1, 2000
3.024
-0.384
-11.26%
jan 1, 2001
3.296
+0.272
8.98%
jan 1, 2002
3.08
-0.215
-6.54%
jan 1, 2003
3.642
+0.562
18.24%
jan 1, 2004
4.658
+1.016
27.89%
jan 1, 2005
4.766
+0.108
2.32%
jan 1, 2006
4.503
-0.263
-5.52%
jan 1, 2007
5.268
+0.765
16.98%
jan 1, 2008
4.761
-0.507
-9.62%
jan 1, 2009
4.799
+0.038
0.8%
jan 1, 2010
3.927
-0.872
-18.17%
jan 1, 2011
5.26
+1.333
33.95%
jan 1, 2012
7.102
+1.841
35.01%
jan 1, 2013
4.923
-2.178
-30.67%
jan 1, 2014
4.739
-0.184
-3.74%
jan 1, 2015
3.836
-0.904
-19.07%
jan 1, 2016
3.689
-0.146
-3.81%
Ranking of countries by current statistics by years


Comments: