29
/
en
AIzaSyAYiBZKx7MnpbEhh9jyipgxe19OcubqV5w
April 1, 2024
154216
India
IND
true
2
1
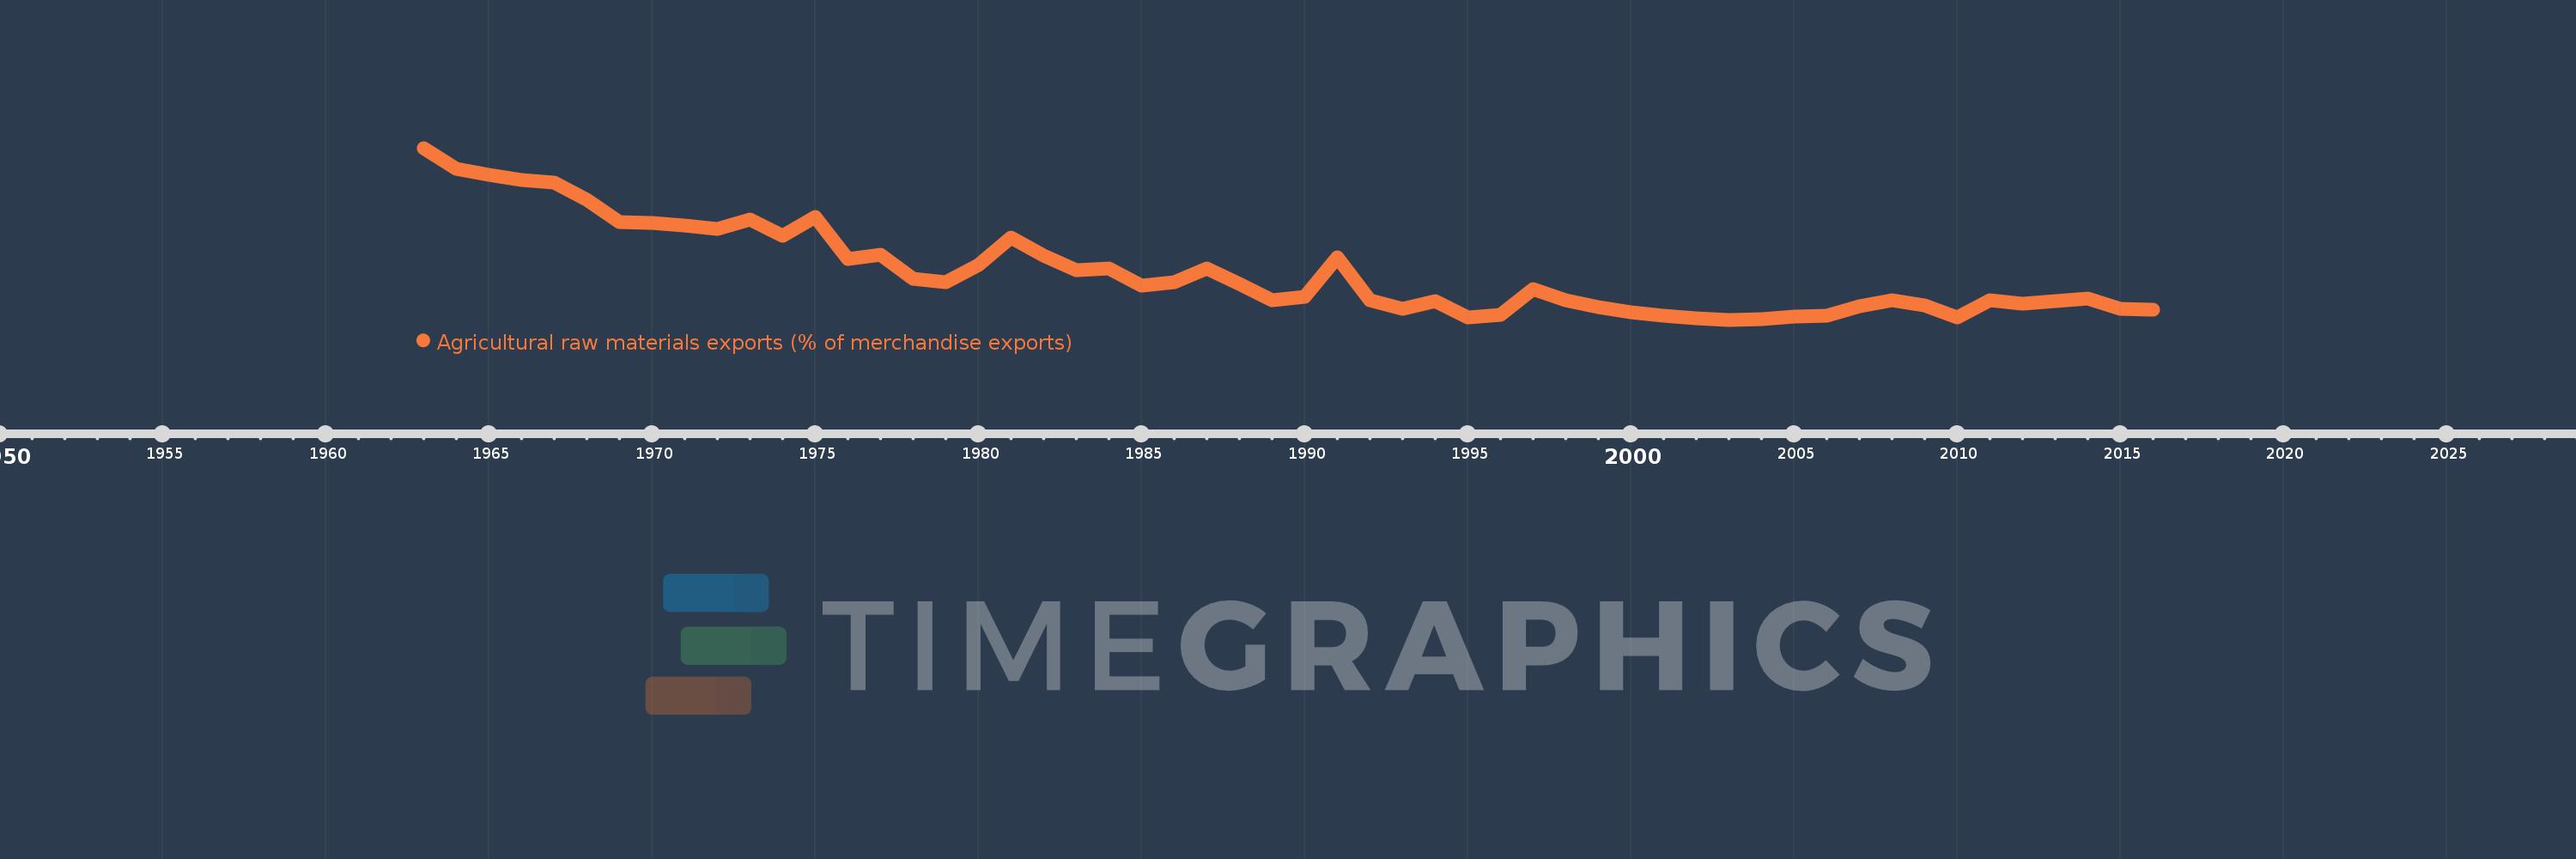
Agricultural raw materials exports (% of merchandise exports)
2016,2015,2014,2013,2012,2011,2010,2009,2008,2007,2006,2005,2004,2003,2002,2001,2000,1999,1998,1997,1996,1995,1994,1993,1992,1991,1990,1989,1988,1987,1986,1985,1984,1983,1982,1981,1980,1979,1978,1977,1976,1975,1974,1973,1972,1971,1970,1969,1968,1967,1966,1965,1964,1963
This statistics in other country:
AfghanistanAlbaniaAlgeriaAndorraAngolaAntigua and BarbudaArab WorldArgentinaArmeniaArubaAustraliaAustriaAzerbaijanBahamas, TheBahrainBangladeshBarbadosBelarusBelgiumBelizeBeninBermudaBhutanBoliviaBosnia and HerzegovinaBotswanaBrazilBrunei DarussalamBulgariaBurkina FasoBurundiCabo VerdeCambodiaCameroonCanadaCaribbean small statesCayman IslandsCentral African RepublicCentral Europe and the BalticsChadChileChinaColombiaComorosCongo, Dem. Rep.Congo, Rep.Costa RicaCote d'IvoireCroatiaCubaCyprusCzech RepublicDenmarkDjiboutiDominicaDominican RepublicEarly-demographic dividendEast Asia & PacificEast Asia & Pacific (excluding high income)East Asia & Pacific (IDA & IBRD countries)EcuadorEgypt, Arab Rep.El SalvadorEquatorial GuineaEritreaEstoniaEthiopiaEuro areaEurope & Central AsiaEurope & Central Asia (excluding high income)Europe & Central Asia (IDA & IBRD countries)European UnionFaroe IslandsFijiFinlandFragile and conflict affected situationsFranceFrench PolynesiaGabonGambia, TheGeorgiaGermanyGhanaGreeceGreenlandGrenadaGuatemalaGuineaGuinea-BissauGuyanaHaitiHeavily indebted poor countries (HIPC)High incomeHondurasHong Kong SAR, ChinaHungaryIBRD onlyIcelandIDA & IBRD totalIDA blendIDA onlyIDA totalIndiaIndonesiaIran, Islamic Rep.IraqIrelandIsraelItalyJamaicaJapanJordanKazakhstanKenyaKiribatiKorea, Rep.KuwaitKyrgyz RepublicLao PDRLate-demographic dividendLatin America & Caribbean Latin America & Caribbean (excluding high income)Latin America & the Caribbean (IDA & IBRD countries)LatviaLeast developed countries: UN classificationLebanonLesothoLiberiaLibyaLithuaniaLow & middle incomeLower middle incomeLuxembourgMacao SAR, ChinaMacedonia, FYRMadagascarMalawiMalaysiaMaldivesMaliMaltaMauritaniaMauritiusMexicoMiddle East & North AfricaMiddle East & North Africa (excluding high income)Middle East & North Africa (IDA & IBRD countries)Middle incomeMoldovaMongoliaMoroccoMozambiqueMyanmarNamibiaNepalNetherlandsNew CaledoniaNew ZealandNicaraguaNigerNigeriaNorth AmericaNorwayOECD membersOmanOther small statesPacific island small statesPakistanPalauPanamaPapua New GuineaParaguayPeruPhilippinesPolandPortugalPost-demographic dividendPre-demographic dividendQatarRomaniaRussian FederationRwandaSamoaSao Tome and PrincipeSaudi ArabiaSenegalSerbiaSeychellesSierra LeoneSingaporeSlovak RepublicSloveniaSmall statesSolomon IslandsSomaliaSouth AfricaSouth AsiaSouth Asia (IDA & IBRD)SpainSri LankaSt. Kitts and NevisSt. LuciaSt. Vincent and the GrenadinesSub-Saharan Africa Sub-Saharan Africa (excluding high income)Sub-Saharan Africa (IDA & IBRD countries)SudanSurinameSwazilandSwedenSwitzerlandSyrian Arab RepublicTajikistanTanzaniaThailandTimor-LesteTogoTongaTrinidad and TobagoTunisiaTurkeyTurkmenistanTurks and Caicos IslandsTuvaluUgandaUkraineUnited Arab EmiratesUnited KingdomUnited StatesUpper middle incomeUruguayVanuatuVenezuela, RBVietnamVirgin Islands (U.S.)WorldYemen, Rep.ZambiaZimbabwe Timeline:
This timeline shows a graph from 1963 to 2016 of India. No data until 1962. Number of actual observations by date: 54.
Source name:
World Development Indicators
Source organization:
World Bank staff estimates from the Comtrade database maintained by the United Nations Statistics Division.
Categories, topics:
Agriculture & Rural Development, Private Sector, Trade
Last updated:
apr 23, 2017
Indicators value changes by year
At the date of observation
Value
Absolute change
Change from previous value
jan 1, 1963
9.257
+9.257
0.0%
jan 1, 1964
8.253
-1.004
-10.85%
jan 1, 1965
7.99
-0.263
-3.18%
jan 1, 1966
7.711
-0.279
-3.49%
jan 1, 1967
7.599
-0.113
-1.46%
jan 1, 1968
6.772
-0.827
-10.88%
jan 1, 1969
5.702
-1.07
-15.8%
jan 1, 1970
5.677
-0.024
-0.43%
jan 1, 1971
5.556
-0.121
-2.13%
jan 1, 1972
5.414
-0.143
-2.57%
jan 1, 1973
5.827
+0.413
7.63%
jan 1, 1974
5.079
-0.748
-12.83%
jan 1, 1975
5.959
+0.881
17.34%
jan 1, 1976
3.979
-1.981
-33.24%
jan 1, 1977
4.176
+0.197
4.95%
jan 1, 1978
3.033
-1.143
-27.38%
jan 1, 1979
2.854
-0.179
-5.9%
jan 1, 1980
3.681
+0.828
29.0%
jan 1, 1981
4.998
+1.317
35.77%
jan 1, 1982
4.119
-0.879
-17.58%
jan 1, 1983
3.437
-0.682
-16.56%
jan 1, 1984
3.521
+0.084
2.45%
jan 1, 1985
2.679
-0.842
-23.92%
jan 1, 1986
2.838
+0.159
5.94%
jan 1, 1987
3.504
+0.666
23.48%
jan 1, 1988
2.79
-0.715
-20.39%
jan 1, 1989
1.974
-0.816
-29.24%
jan 1, 1990
2.141
+0.167
8.44%
jan 1, 1991
4.051
+1.91
89.24%
jan 1, 1992
2.008
-2.043
-50.44%
jan 1, 1993
1.596
-0.412
-20.52%
jan 1, 1994
1.972
+0.376
23.57%
jan 1, 1995
1.192
-0.78
-39.54%
jan 1, 1996
1.294
+0.102
8.54%
jan 1, 1997
2.533
+1.239
95.75%
jan 1, 1998
2.004
-0.529
-20.89%
jan 1, 1999
1.656
-0.348
-17.37%
jan 1, 2000
1.418
-0.238
-14.36%
jan 1, 2001
1.259
-0.159
-11.23%
jan 1, 2002
1.139
-0.119
-9.49%
jan 1, 2003
1.063
-0.077
-6.73%
jan 1, 2004
1.08
+0.017
1.6%
jan 1, 2005
1.204
+0.124
11.49%
jan 1, 2006
1.268
+0.064
5.31%
jan 1, 2007
1.718
+0.45
35.5%
jan 1, 2008
1.983
+0.265
15.43%
jan 1, 2009
1.735
-0.248
-12.49%
jan 1, 2010
1.165
-0.571
-32.88%
jan 1, 2011
2.006
+0.841
72.22%
jan 1, 2012
1.83
-0.176
-8.79%
jan 1, 2013
1.955
+0.125
6.83%
jan 1, 2014
2.062
+0.107
5.47%
jan 1, 2015
1.575
-0.487
-23.62%
jan 1, 2016
1.532
-0.042
-2.7%
Ranking of countries by current statistics by years


Comments: