29
/
en
AIzaSyAYiBZKx7MnpbEhh9jyipgxe19OcubqV5w
April 1, 2024
90753
Brazil
BRA
true
2
1
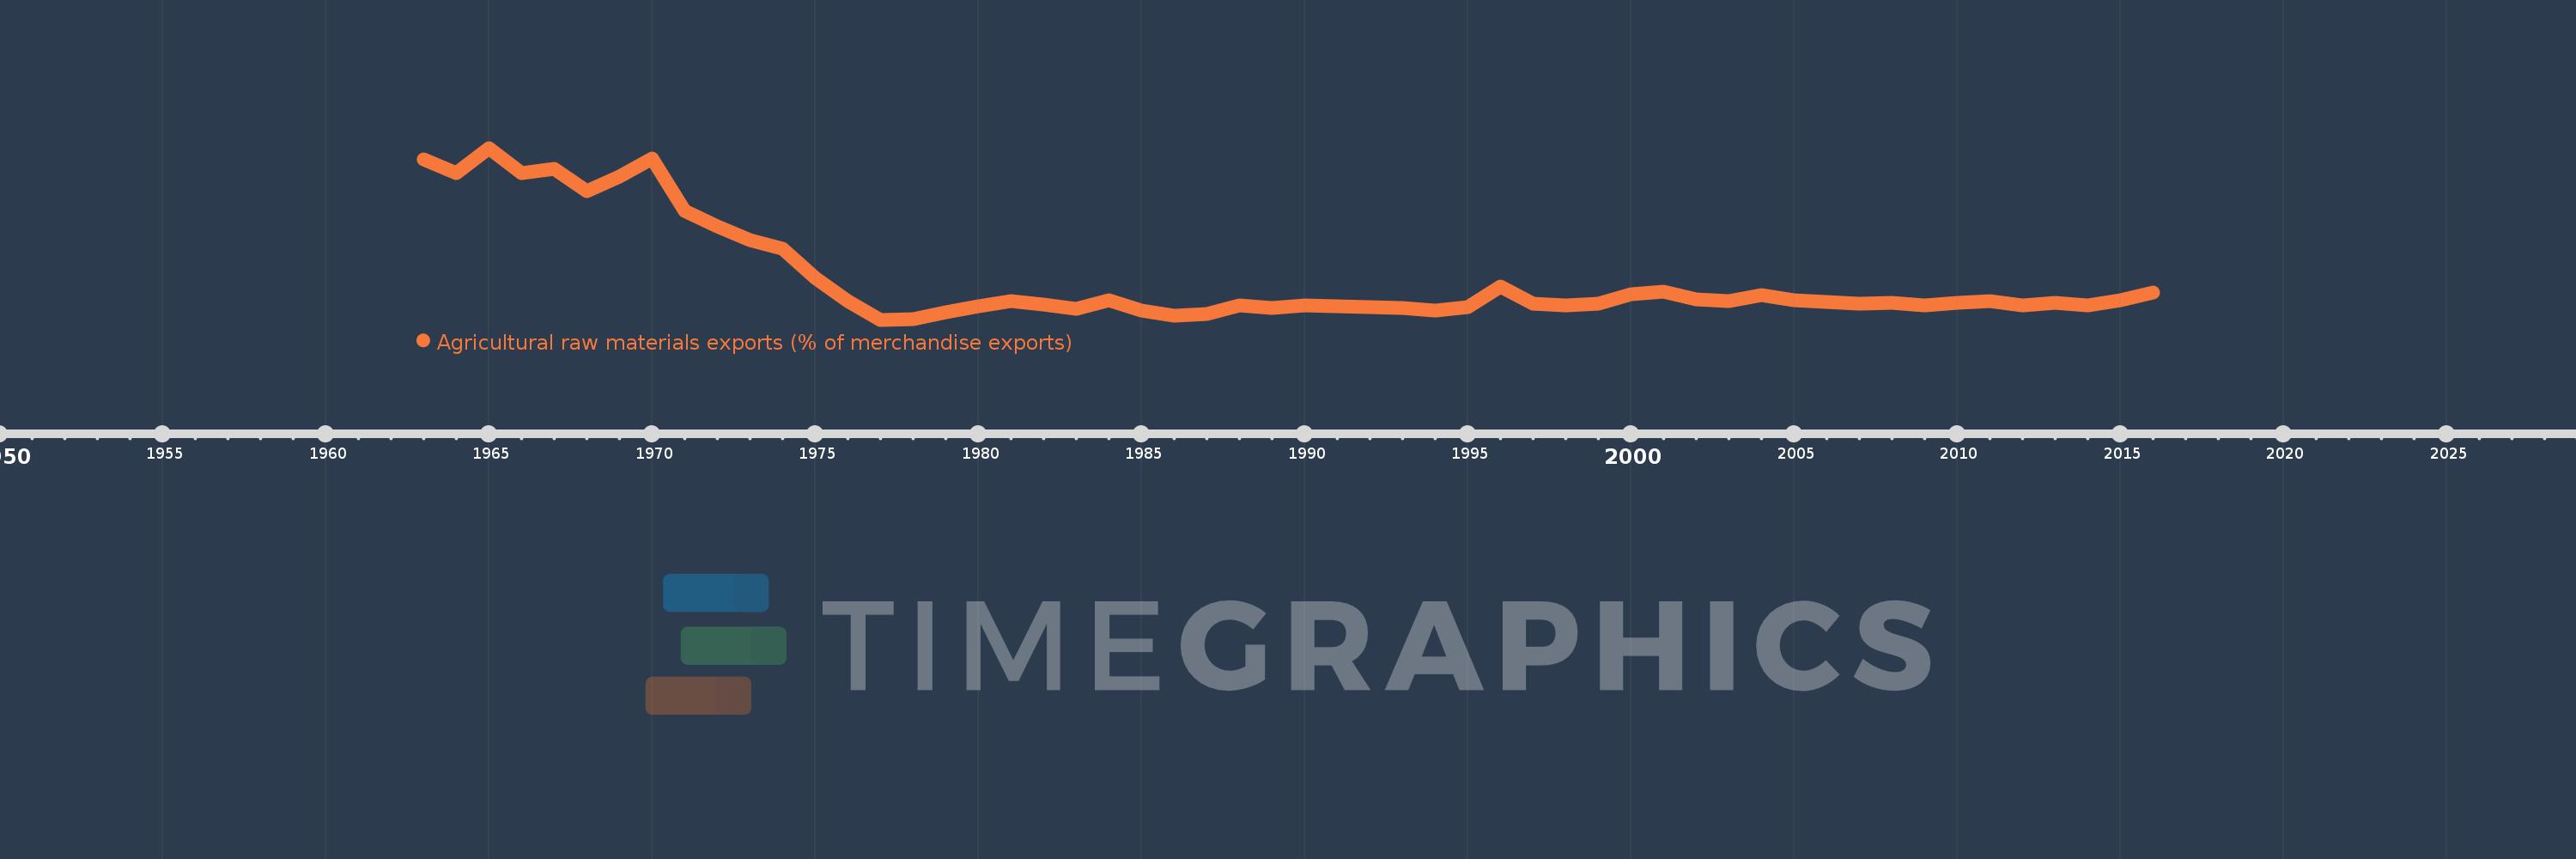
Agricultural raw materials exports (% of merchandise exports)
2016,2015,2014,2013,2012,2011,2010,2009,2008,2007,2006,2005,2004,2003,2002,2001,2000,1999,1998,1997,1996,1995,1994,1993,1992,1991,1990,1989,1988,1987,1986,1985,1984,1983,1982,1981,1980,1979,1978,1977,1976,1975,1974,1973,1972,1971,1970,1969,1968,1967,1966,1965,1964,1963
This statistics in other country:
AfghanistanAlbaniaAlgeriaAndorraAngolaAntigua and BarbudaArab WorldArgentinaArmeniaArubaAustraliaAustriaAzerbaijanBahamas, TheBahrainBangladeshBarbadosBelarusBelgiumBelizeBeninBermudaBhutanBoliviaBosnia and HerzegovinaBotswanaBrazilBrunei DarussalamBulgariaBurkina FasoBurundiCabo VerdeCambodiaCameroonCanadaCaribbean small statesCayman IslandsCentral African RepublicCentral Europe and the BalticsChadChileChinaColombiaComorosCongo, Dem. Rep.Congo, Rep.Costa RicaCote d'IvoireCroatiaCubaCyprusCzech RepublicDenmarkDjiboutiDominicaDominican RepublicEarly-demographic dividendEast Asia & PacificEast Asia & Pacific (excluding high income)East Asia & Pacific (IDA & IBRD countries)EcuadorEgypt, Arab Rep.El SalvadorEquatorial GuineaEritreaEstoniaEthiopiaEuro areaEurope & Central AsiaEurope & Central Asia (excluding high income)Europe & Central Asia (IDA & IBRD countries)European UnionFaroe IslandsFijiFinlandFragile and conflict affected situationsFranceFrench PolynesiaGabonGambia, TheGeorgiaGermanyGhanaGreeceGreenlandGrenadaGuatemalaGuineaGuinea-BissauGuyanaHaitiHeavily indebted poor countries (HIPC)High incomeHondurasHong Kong SAR, ChinaHungaryIBRD onlyIcelandIDA & IBRD totalIDA blendIDA onlyIDA totalIndiaIndonesiaIran, Islamic Rep.IraqIrelandIsraelItalyJamaicaJapanJordanKazakhstanKenyaKiribatiKorea, Rep.KuwaitKyrgyz RepublicLao PDRLate-demographic dividendLatin America & Caribbean Latin America & Caribbean (excluding high income)Latin America & the Caribbean (IDA & IBRD countries)LatviaLeast developed countries: UN classificationLebanonLesothoLiberiaLibyaLithuaniaLow & middle incomeLower middle incomeLuxembourgMacao SAR, ChinaMacedonia, FYRMadagascarMalawiMalaysiaMaldivesMaliMaltaMauritaniaMauritiusMexicoMiddle East & North AfricaMiddle East & North Africa (excluding high income)Middle East & North Africa (IDA & IBRD countries)Middle incomeMoldovaMongoliaMoroccoMozambiqueMyanmarNamibiaNepalNetherlandsNew CaledoniaNew ZealandNicaraguaNigerNigeriaNorth AmericaNorwayOECD membersOmanOther small statesPacific island small statesPakistanPalauPanamaPapua New GuineaParaguayPeruPhilippinesPolandPortugalPost-demographic dividendPre-demographic dividendQatarRomaniaRussian FederationRwandaSamoaSao Tome and PrincipeSaudi ArabiaSenegalSerbiaSeychellesSierra LeoneSingaporeSlovak RepublicSloveniaSmall statesSolomon IslandsSomaliaSouth AfricaSouth AsiaSouth Asia (IDA & IBRD)SpainSri LankaSt. Kitts and NevisSt. LuciaSt. Vincent and the GrenadinesSub-Saharan Africa Sub-Saharan Africa (excluding high income)Sub-Saharan Africa (IDA & IBRD countries)SudanSurinameSwazilandSwedenSwitzerlandSyrian Arab RepublicTajikistanTanzaniaThailandTimor-LesteTogoTongaTrinidad and TobagoTunisiaTurkeyTurkmenistanTurks and Caicos IslandsTuvaluUgandaUkraineUnited Arab EmiratesUnited KingdomUnited StatesUpper middle incomeUruguayVanuatuVenezuela, RBVietnamVirgin Islands (U.S.)WorldYemen, Rep.ZambiaZimbabwe Timeline:
This timeline shows a graph from 1963 to 2016 of Brazil. No data until 1962. Number of actual observations by date: 54.
Source name:
World Development Indicators
Source organization:
World Bank staff estimates from the Comtrade database maintained by the United Nations Statistics Division.
Categories, topics:
Agriculture & Rural Development, Private Sector, Trade
Last updated:
apr 23, 2017
Indicators value changes by year
Maximum:
17.442
jan 1, 1965
At the date of observation
Value
Absolute change
Change from previous value
jan 1, 1963
16.402
+16.402
0.0%
jan 1, 1964
15.195
-1.206
-7.36%
jan 1, 1965
17.442
+2.247
14.78%
jan 1, 1966
15.232
-2.21
-12.67%
jan 1, 1967
15.588
+0.356
2.33%
jan 1, 1968
13.634
-1.954
-12.53%
jan 1, 1969
14.917
+1.283
9.41%
jan 1, 1970
16.486
+1.569
10.51%
jan 1, 1971
11.895
-4.591
-27.85%
jan 1, 1972
10.494
-1.401
-11.78%
jan 1, 1973
9.322
-1.172
-11.16%
jan 1, 1974
8.521
-0.801
-8.6%
jan 1, 1975
5.991
-2.53
-29.69%
jan 1, 1976
3.892
-2.1
-35.04%
jan 1, 1977
2.273
-1.618
-41.59%
jan 1, 1978
2.354
+0.08
3.53%
jan 1, 1979
2.919
+0.565
24.02%
jan 1, 1980
3.442
+0.523
17.93%
jan 1, 1981
3.956
+0.514
14.93%
jan 1, 1982
3.585
-0.371
-9.39%
jan 1, 1983
3.199
-0.385
-10.75%
jan 1, 1984
4.032
+0.832
26.02%
jan 1, 1985
3.084
-0.948
-23.51%
jan 1, 1986
2.61
-0.473
-15.35%
jan 1, 1987
2.812
+0.202
7.74%
jan 1, 1988
3.525
+0.713
25.34%
jan 1, 1989
3.343
-0.182
-5.16%
jan 1, 1990
3.515
+0.172
5.15%
jan 1, 1991
3.444
-0.071
-2.01%
jan 1, 1992
3.394
-0.051
-1.47%
jan 1, 1993
3.294
-0.099
-2.93%
jan 1, 1994
3.06
-0.234
-7.12%
jan 1, 1995
3.406
+0.346
11.31%
jan 1, 1996
5.225
+1.819
53.41%
jan 1, 1997
3.703
-1.522
-29.12%
jan 1, 1998
3.564
-0.139
-3.76%
jan 1, 1999
3.717
+0.153
4.28%
jan 1, 2000
4.507
+0.79
21.26%
jan 1, 2001
4.757
+0.25
5.55%
jan 1, 2002
4.104
-0.654
-13.74%
jan 1, 2003
3.919
-0.185
-4.51%
jan 1, 2004
4.487
+0.568
14.5%
jan 1, 2005
3.977
-0.51
-11.36%
jan 1, 2006
3.828
-0.15
-3.76%
jan 1, 2007
3.704
-0.123
-3.22%
jan 1, 2008
3.782
+0.078
2.1%
jan 1, 2009
3.531
-0.251
-6.63%
jan 1, 2010
3.771
+0.24
6.79%
jan 1, 2011
3.936
+0.165
4.37%
jan 1, 2012
3.532
-0.403
-10.25%
jan 1, 2013
3.795
+0.263
7.44%
jan 1, 2014
3.529
-0.266
-7.0%
jan 1, 2015
4.012
+0.482
13.67%
jan 1, 2016
4.698
+0.686
17.1%
Ranking of countries by current statistics by years


Comments: