29
/
en
AIzaSyAYiBZKx7MnpbEhh9jyipgxe19OcubqV5w
April 1, 2024
162184
Jamaica
JAM
true
2
1
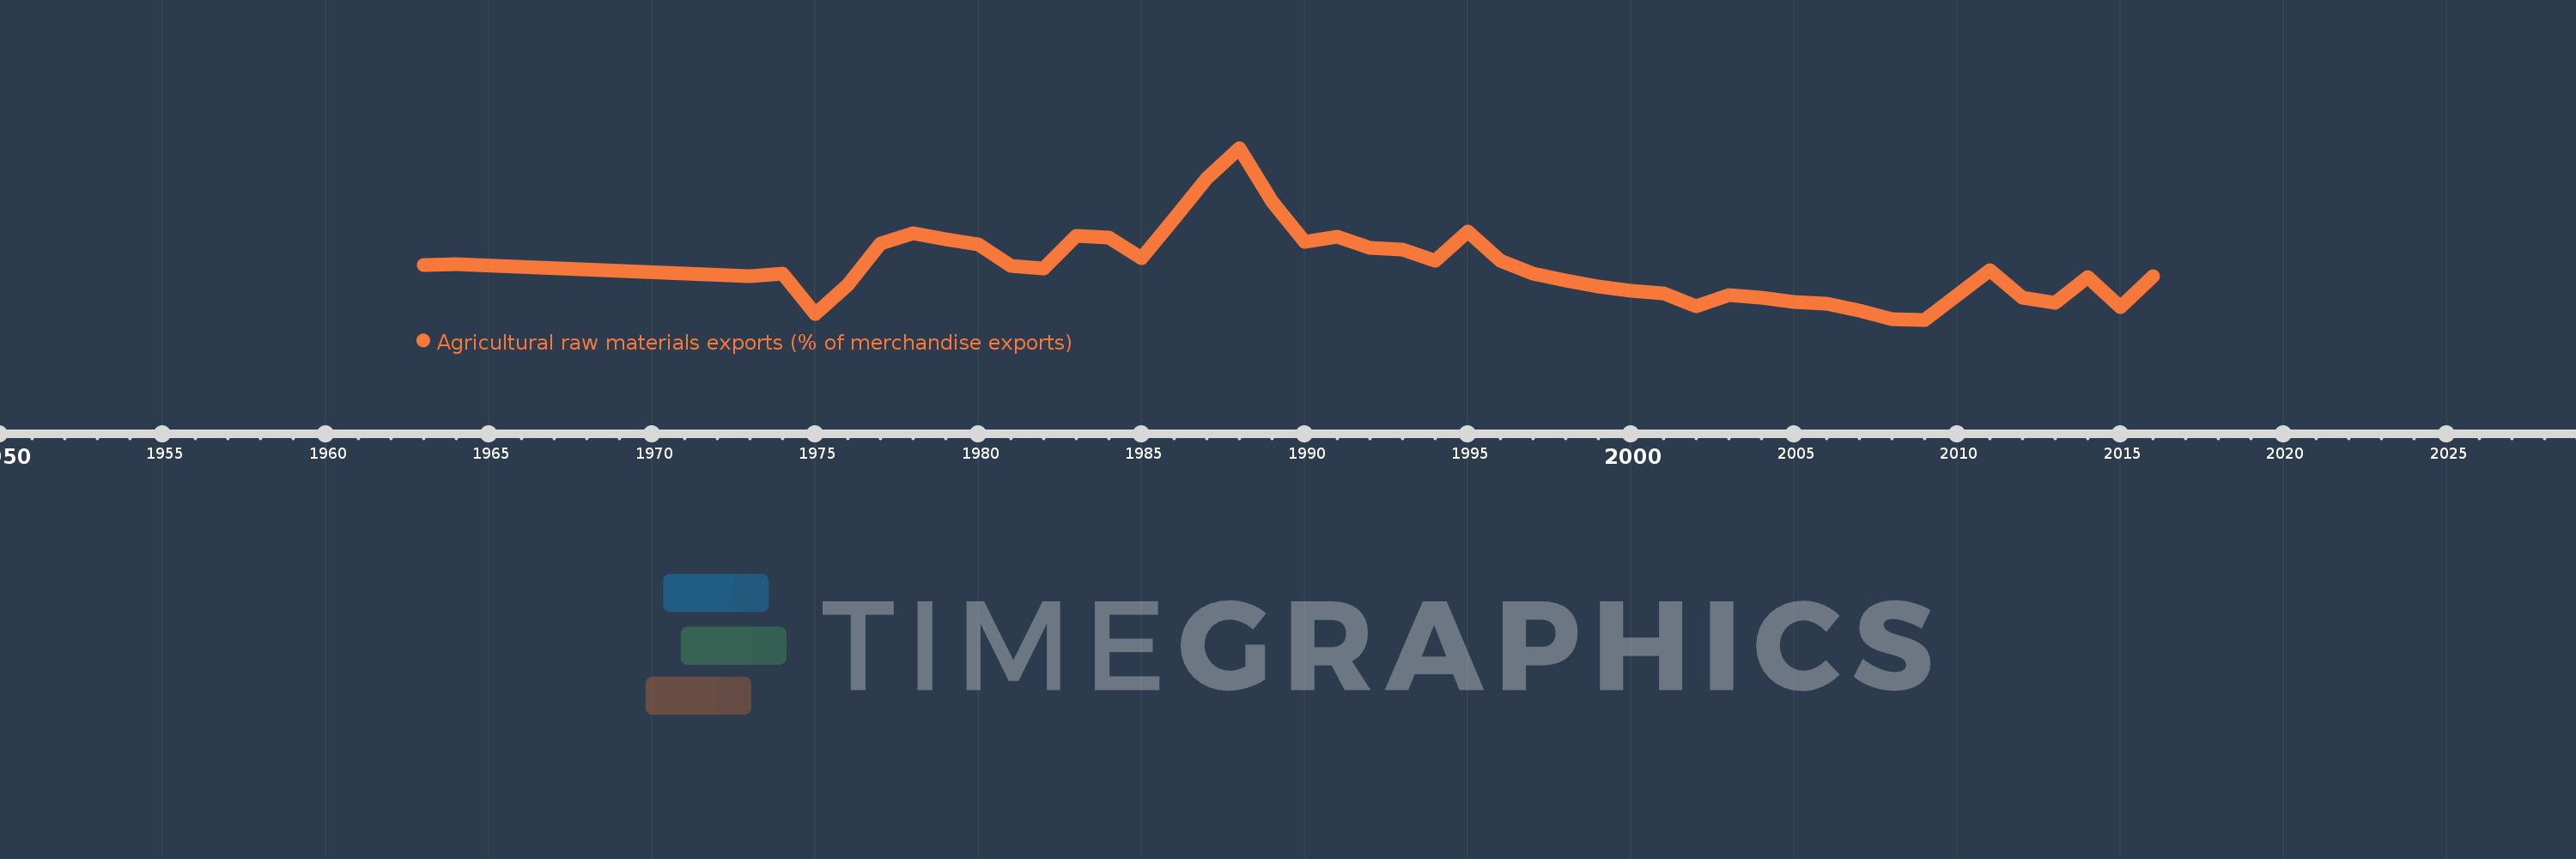
Agricultural raw materials exports (% of merchandise exports)
2016,2015,2014,2013,2012,2011,2010,2009,2008,2007,2006,2005,2004,2003,2002,2001,2000,1999,1998,1997,1996,1995,1994,1993,1992,1991,1990,1989,1988,1987,1986,1985,1984,1983,1982,1981,1980,1979,1978,1977,1976,1975,1974,1973,1964,1963
This statistics in other country:
AfghanistanAlbaniaAlgeriaAndorraAngolaAntigua and BarbudaArab WorldArgentinaArmeniaArubaAustraliaAustriaAzerbaijanBahamas, TheBahrainBangladeshBarbadosBelarusBelgiumBelizeBeninBermudaBhutanBoliviaBosnia and HerzegovinaBotswanaBrazilBrunei DarussalamBulgariaBurkina FasoBurundiCabo VerdeCambodiaCameroonCanadaCaribbean small statesCayman IslandsCentral African RepublicCentral Europe and the BalticsChadChileChinaColombiaComorosCongo, Dem. Rep.Congo, Rep.Costa RicaCote d'IvoireCroatiaCubaCyprusCzech RepublicDenmarkDjiboutiDominicaDominican RepublicEarly-demographic dividendEast Asia & PacificEast Asia & Pacific (excluding high income)East Asia & Pacific (IDA & IBRD countries)EcuadorEgypt, Arab Rep.El SalvadorEquatorial GuineaEritreaEstoniaEthiopiaEuro areaEurope & Central AsiaEurope & Central Asia (excluding high income)Europe & Central Asia (IDA & IBRD countries)European UnionFaroe IslandsFijiFinlandFragile and conflict affected situationsFranceFrench PolynesiaGabonGambia, TheGeorgiaGermanyGhanaGreeceGreenlandGrenadaGuatemalaGuineaGuinea-BissauGuyanaHaitiHeavily indebted poor countries (HIPC)High incomeHondurasHong Kong SAR, ChinaHungaryIBRD onlyIcelandIDA & IBRD totalIDA blendIDA onlyIDA totalIndiaIndonesiaIran, Islamic Rep.IraqIrelandIsraelItalyJamaicaJapanJordanKazakhstanKenyaKiribatiKorea, Rep.KuwaitKyrgyz RepublicLao PDRLate-demographic dividendLatin America & Caribbean Latin America & Caribbean (excluding high income)Latin America & the Caribbean (IDA & IBRD countries)LatviaLeast developed countries: UN classificationLebanonLesothoLiberiaLibyaLithuaniaLow & middle incomeLower middle incomeLuxembourgMacao SAR, ChinaMacedonia, FYRMadagascarMalawiMalaysiaMaldivesMaliMaltaMauritaniaMauritiusMexicoMiddle East & North AfricaMiddle East & North Africa (excluding high income)Middle East & North Africa (IDA & IBRD countries)Middle incomeMoldovaMongoliaMoroccoMozambiqueMyanmarNamibiaNepalNetherlandsNew CaledoniaNew ZealandNicaraguaNigerNigeriaNorth AmericaNorwayOECD membersOmanOther small statesPacific island small statesPakistanPalauPanamaPapua New GuineaParaguayPeruPhilippinesPolandPortugalPost-demographic dividendPre-demographic dividendQatarRomaniaRussian FederationRwandaSamoaSao Tome and PrincipeSaudi ArabiaSenegalSerbiaSeychellesSierra LeoneSingaporeSlovak RepublicSloveniaSmall statesSolomon IslandsSomaliaSouth AfricaSouth AsiaSouth Asia (IDA & IBRD)SpainSri LankaSt. Kitts and NevisSt. LuciaSt. Vincent and the GrenadinesSub-Saharan Africa Sub-Saharan Africa (excluding high income)Sub-Saharan Africa (IDA & IBRD countries)SudanSurinameSwazilandSwedenSwitzerlandSyrian Arab RepublicTajikistanTanzaniaThailandTimor-LesteTogoTongaTrinidad and TobagoTunisiaTurkeyTurkmenistanTurks and Caicos IslandsTuvaluUgandaUkraineUnited Arab EmiratesUnited KingdomUnited StatesUpper middle incomeUruguayVanuatuVenezuela, RBVietnamVirgin Islands (U.S.)WorldYemen, Rep.ZambiaZimbabwe Timeline:
This timeline shows a graph from 1963 to 2016 of Jamaica. No data until 1962. Number of actual observations by date: 46.
Source name:
World Development Indicators
Source organization:
World Bank staff estimates from the Comtrade database maintained by the United Nations Statistics Division.
Categories, topics:
Agriculture & Rural Development, Private Sector, Trade
Last updated:
apr 23, 2017
Indicators value changes by year
At the date of observation
Value
Absolute change
Change from previous value
jan 1, 1963
0.267
+0.267
0.0%
jan 1, 1964
0.27
+0.003
1.22%
jan 1, 1973
0.225
-0.045
-16.8%
jan 1, 1974
0.237
+0.012
5.34%
jan 1, 1975
0.087
-0.15
-63.42%
jan 1, 1976
0.195
+0.108
125.06%
jan 1, 1977
0.346
+0.151
77.64%
jan 1, 1978
0.383
+0.037
10.67%
jan 1, 1979
0.362
-0.021
-5.5%
jan 1, 1980
0.341
-0.021
-5.76%
jan 1, 1981
0.265
-0.076
-22.37%
jan 1, 1982
0.253
-0.012
-4.41%
jan 1, 1983
0.373
+0.12
47.53%
jan 1, 1984
0.368
-0.005
-1.37%
jan 1, 1985
0.291
-0.077
-20.92%
jan 1, 1986
0.436
+0.144
49.55%
jan 1, 1987
0.584
+0.148
34.02%
jan 1, 1988
0.695
+0.112
19.11%
jan 1, 1989
0.499
-0.197
-28.31%
jan 1, 1990
0.352
-0.147
-29.45%
jan 1, 1991
0.37
+0.018
5.12%
jan 1, 1992
0.329
-0.041
-11.03%
jan 1, 1993
0.323
-0.006
-1.82%
jan 1, 1994
0.283
-0.04
-12.32%
jan 1, 1995
0.391
+0.108
38.09%
jan 1, 1996
0.284
-0.107
-27.34%
jan 1, 1997
0.236
-0.048
-16.94%
jan 1, 1998
0.21
-0.026
-10.99%
jan 1, 1999
0.187
-0.023
-10.83%
jan 1, 2000
0.172
-0.015
-8.17%
jan 1, 2001
0.164
-0.008
-4.46%
jan 1, 2002
0.117
-0.047
-28.52%
jan 1, 2003
0.158
+0.04
34.18%
jan 1, 2004
0.147
-0.01
-6.43%
jan 1, 2005
0.133
-0.015
-9.98%
jan 1, 2006
0.126
-0.007
-5.35%
jan 1, 2007
0.1
-0.026
-20.47%
jan 1, 2008
0.068
-0.032
-32.05%
jan 1, 2009
0.067
-0.001
-1.63%
jan 1, 2010
0.156
+0.09
134.18%
jan 1, 2011
0.247
+0.09
57.69%
jan 1, 2012
0.147
-0.099
-40.23%
jan 1, 2013
0.129
-0.019
-12.58%
jan 1, 2014
0.222
+0.093
72.39%
jan 1, 2015
0.114
-0.108
-48.8%
jan 1, 2016
0.225
+0.111
97.85%
Ranking of countries by current statistics by years


Comments: