29
/
en
AIzaSyAYiBZKx7MnpbEhh9jyipgxe19OcubqV5w
April 1, 2024
191140
Malta
MLT
true
2
1
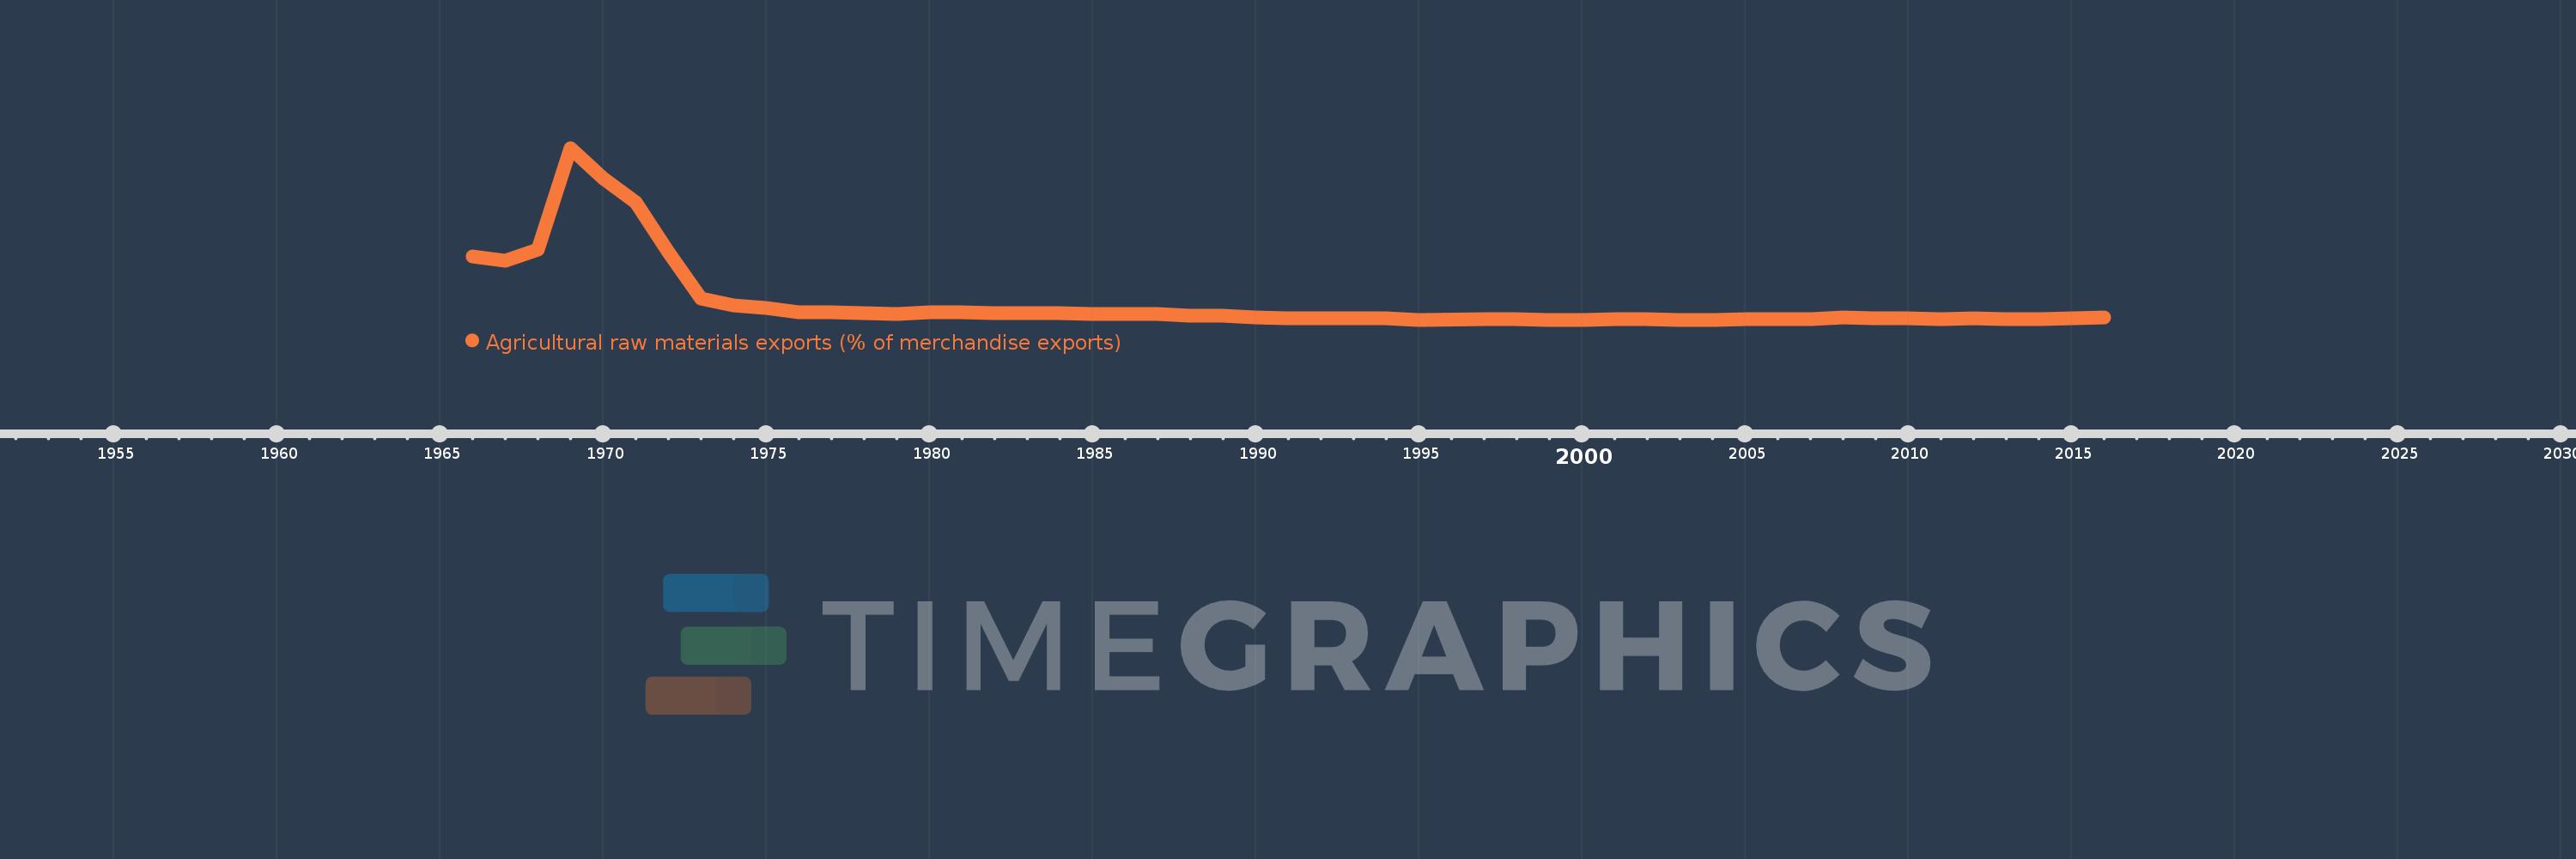
Agricultural raw materials exports (% of merchandise exports)
2016,2015,2014,2013,2012,2011,2010,2009,2008,2007,2006,2005,2004,2003,2002,2001,2000,1999,1998,1997,1995,1994,1993,1992,1991,1990,1989,1988,1987,1986,1985,1984,1983,1982,1981,1980,1979,1978,1977,1976,1975,1974,1973,1972,1971,1970,1969,1968,1967,1966
This statistics in other country:
AfghanistanAlbaniaAlgeriaAndorraAngolaAntigua and BarbudaArab WorldArgentinaArmeniaArubaAustraliaAustriaAzerbaijanBahamas, TheBahrainBangladeshBarbadosBelarusBelgiumBelizeBeninBermudaBhutanBoliviaBosnia and HerzegovinaBotswanaBrazilBrunei DarussalamBulgariaBurkina FasoBurundiCabo VerdeCambodiaCameroonCanadaCaribbean small statesCayman IslandsCentral African RepublicCentral Europe and the BalticsChadChileChinaColombiaComorosCongo, Dem. Rep.Congo, Rep.Costa RicaCote d'IvoireCroatiaCubaCyprusCzech RepublicDenmarkDjiboutiDominicaDominican RepublicEarly-demographic dividendEast Asia & PacificEast Asia & Pacific (excluding high income)East Asia & Pacific (IDA & IBRD countries)EcuadorEgypt, Arab Rep.El SalvadorEquatorial GuineaEritreaEstoniaEthiopiaEuro areaEurope & Central AsiaEurope & Central Asia (excluding high income)Europe & Central Asia (IDA & IBRD countries)European UnionFaroe IslandsFijiFinlandFragile and conflict affected situationsFranceFrench PolynesiaGabonGambia, TheGeorgiaGermanyGhanaGreeceGreenlandGrenadaGuatemalaGuineaGuinea-BissauGuyanaHaitiHeavily indebted poor countries (HIPC)High incomeHondurasHong Kong SAR, ChinaHungaryIBRD onlyIcelandIDA & IBRD totalIDA blendIDA onlyIDA totalIndiaIndonesiaIran, Islamic Rep.IraqIrelandIsraelItalyJamaicaJapanJordanKazakhstanKenyaKiribatiKorea, Rep.KuwaitKyrgyz RepublicLao PDRLate-demographic dividendLatin America & Caribbean Latin America & Caribbean (excluding high income)Latin America & the Caribbean (IDA & IBRD countries)LatviaLeast developed countries: UN classificationLebanonLesothoLiberiaLibyaLithuaniaLow & middle incomeLower middle incomeLuxembourgMacao SAR, ChinaMacedonia, FYRMadagascarMalawiMalaysiaMaldivesMaliMaltaMauritaniaMauritiusMexicoMiddle East & North AfricaMiddle East & North Africa (excluding high income)Middle East & North Africa (IDA & IBRD countries)Middle incomeMoldovaMongoliaMoroccoMozambiqueMyanmarNamibiaNepalNetherlandsNew CaledoniaNew ZealandNicaraguaNigerNigeriaNorth AmericaNorwayOECD membersOmanOther small statesPacific island small statesPakistanPalauPanamaPapua New GuineaParaguayPeruPhilippinesPolandPortugalPost-demographic dividendPre-demographic dividendQatarRomaniaRussian FederationRwandaSamoaSao Tome and PrincipeSaudi ArabiaSenegalSerbiaSeychellesSierra LeoneSingaporeSlovak RepublicSloveniaSmall statesSolomon IslandsSomaliaSouth AfricaSouth AsiaSouth Asia (IDA & IBRD)SpainSri LankaSt. Kitts and NevisSt. LuciaSt. Vincent and the GrenadinesSub-Saharan Africa Sub-Saharan Africa (excluding high income)Sub-Saharan Africa (IDA & IBRD countries)SudanSurinameSwazilandSwedenSwitzerlandSyrian Arab RepublicTajikistanTanzaniaThailandTimor-LesteTogoTongaTrinidad and TobagoTunisiaTurkeyTurkmenistanTurks and Caicos IslandsTuvaluUgandaUkraineUnited Arab EmiratesUnited KingdomUnited StatesUpper middle incomeUruguayVanuatuVenezuela, RBVietnamVirgin Islands (U.S.)WorldYemen, Rep.ZambiaZimbabwe Timeline:
This timeline shows a graph from 1966 to 2016 of Malta. No data until 1965. Number of actual observations by date: 50.
Source name:
World Development Indicators
Source organization:
World Bank staff estimates from the Comtrade database maintained by the United Nations Statistics Division.
Categories, topics:
Agriculture & Rural Development, Private Sector, Trade
Last updated:
apr 23, 2017
Indicators value changes by year
Maximum:
11.994
jan 1, 1969
At the date of observation
Value
Absolute change
Change from previous value
jan 1, 1966
4.444
+4.444
0.0%
jan 1, 1967
4.116
-0.328
-7.37%
jan 1, 1968
4.927
+0.811
19.69%
jan 1, 1969
11.994
+7.067
143.44%
jan 1, 1970
9.908
-2.086
-17.39%
jan 1, 1971
8.238
-1.67
-16.86%
jan 1, 1972
4.727
-3.51
-42.61%
jan 1, 1973
1.538
-3.189
-67.46%
jan 1, 1974
1.06
-0.478
-31.09%
jan 1, 1975
0.862
-0.198
-18.7%
jan 1, 1976
0.576
-0.286
-33.2%
jan 1, 1977
0.546
-0.029
-5.09%
jan 1, 1978
0.472
-0.075
-13.69%
jan 1, 1979
0.439
-0.033
-6.9%
jan 1, 1980
0.56
+0.121
27.46%
jan 1, 1981
0.585
+0.025
4.47%
jan 1, 1982
0.477
-0.108
-18.46%
jan 1, 1983
0.505
+0.029
6.03%
jan 1, 1984
0.506
+0.0
0.08%
jan 1, 1985
0.455
-0.05
-9.98%
jan 1, 1986
0.442
-0.013
-2.93%
jan 1, 1987
0.419
-0.023
-5.28%
jan 1, 1988
0.322
-0.096
-23.0%
jan 1, 1989
0.297
-0.025
-7.78%
jan 1, 1990
0.182
-0.115
-38.76%
jan 1, 1991
0.139
-0.043
-23.53%
jan 1, 1992
0.119
-0.02
-14.27%
jan 1, 1993
0.116
-0.003
-2.69%
jan 1, 1994
0.143
+0.027
22.89%
jan 1, 1995
0.039
-0.104
-72.98%
jan 1, 1997
0.076
+0.037
96.07%
jan 1, 1998
0.104
+0.029
37.91%
jan 1, 1999
0.044
-0.06
-57.43%
jan 1, 2000
0.047
+0.003
6.35%
jan 1, 2001
0.059
+0.012
24.38%
jan 1, 2002
0.065
+0.006
10.31%
jan 1, 2003
0.045
-0.02
-30.14%
jan 1, 2004
0.046
+0.0
0.58%
jan 1, 2005
0.051
+0.006
12.36%
jan 1, 2006
0.075
+0.024
46.73%
jan 1, 2007
0.066
-0.009
-12.33%
jan 1, 2008
0.196
+0.13
197.78%
jan 1, 2009
0.128
-0.068
-34.88%
jan 1, 2010
0.13
+0.003
2.1%
jan 1, 2011
0.098
-0.033
-25.02%
jan 1, 2012
0.113
+0.015
15.25%
jan 1, 2013
0.103
-0.01
-8.63%
jan 1, 2014
0.11
+0.007
7.12%
jan 1, 2015
0.135
+0.025
22.95%
jan 1, 2016
0.186
+0.051
37.32%
Ranking of countries by current statistics by years


Comments: