29
/
en
AIzaSyAYiBZKx7MnpbEhh9jyipgxe19OcubqV5w
April 1, 2024
118635
Denmark
DNK
true
2
1
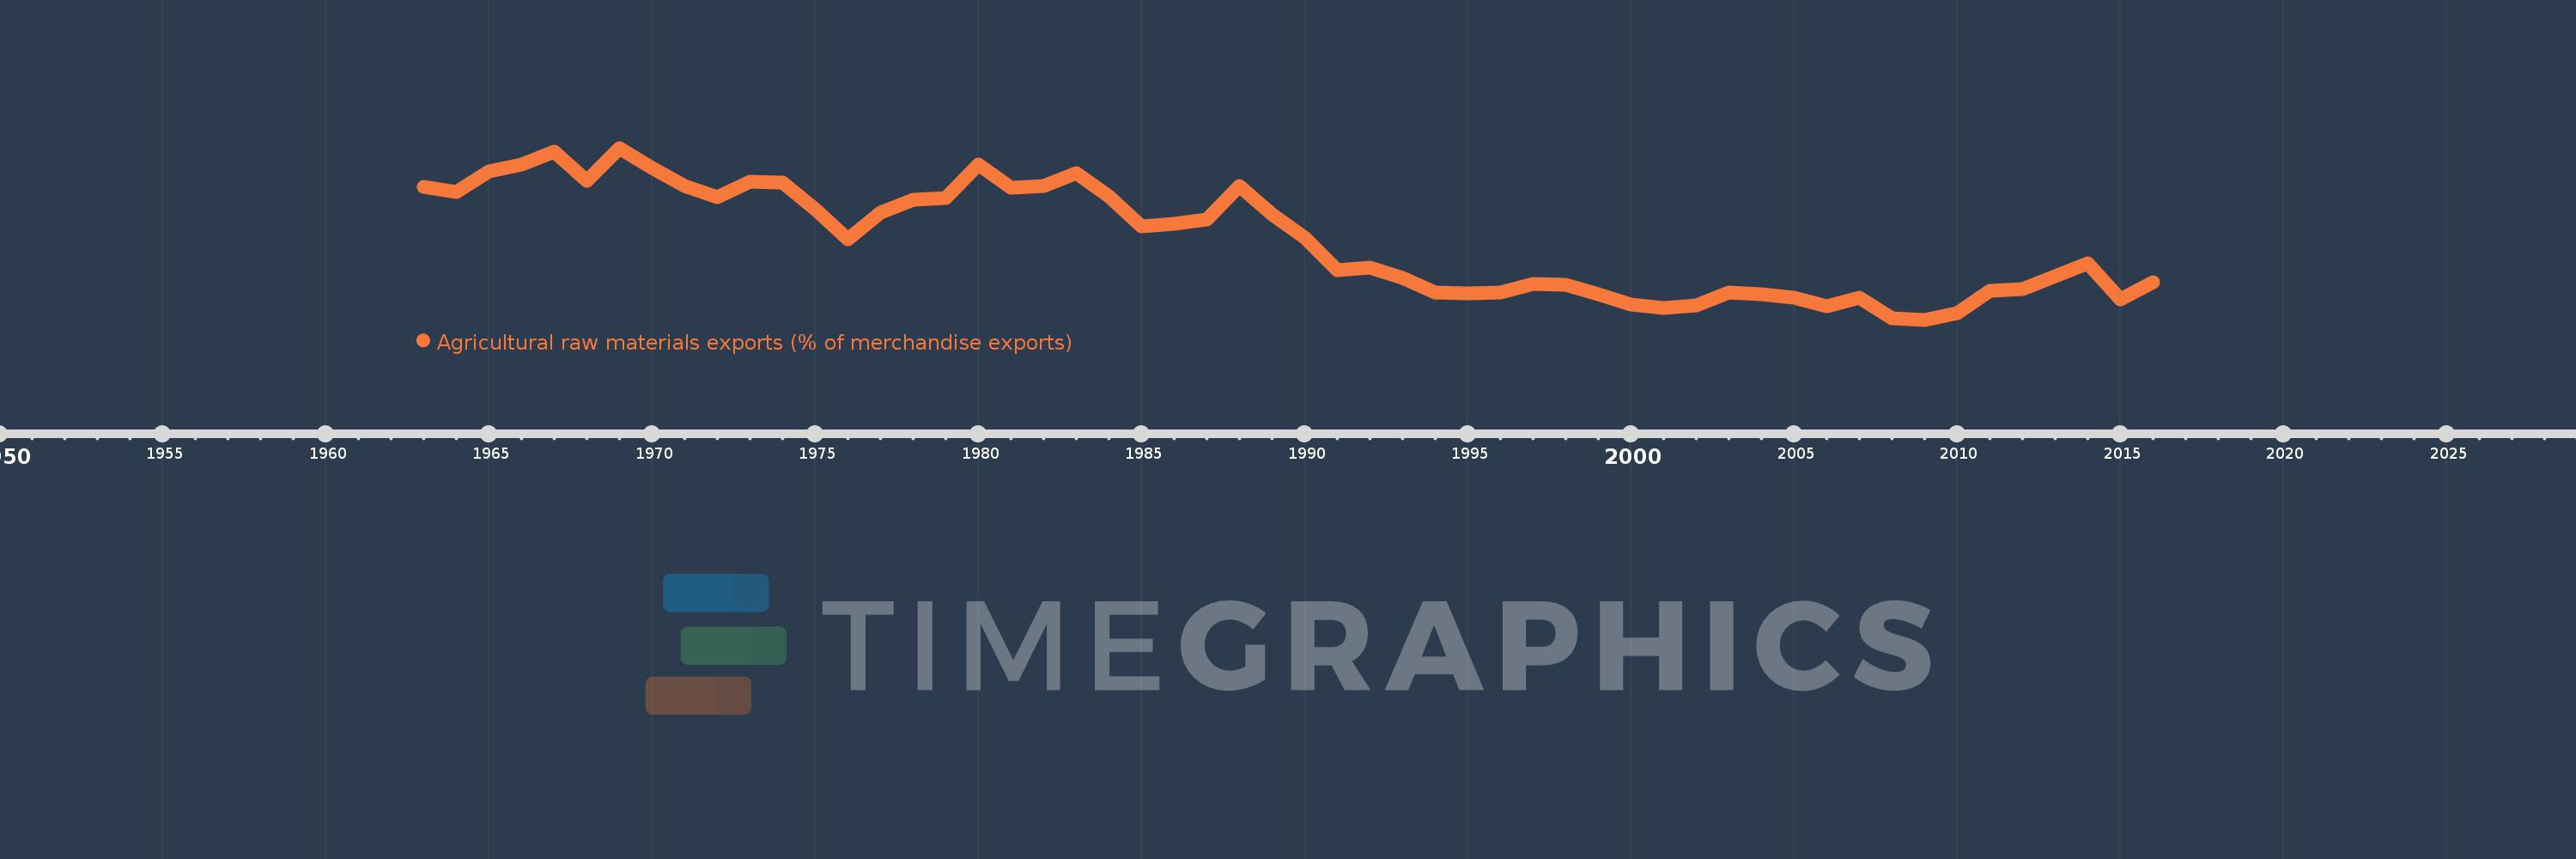
Agricultural raw materials exports (% of merchandise exports)
2016,2015,2014,2013,2012,2011,2010,2009,2008,2007,2006,2005,2004,2003,2002,2001,2000,1999,1998,1997,1996,1995,1994,1993,1992,1991,1990,1989,1988,1987,1986,1985,1984,1983,1982,1981,1980,1979,1978,1977,1976,1975,1974,1973,1972,1971,1970,1969,1968,1967,1966,1965,1964,1963
This statistics in other country:
AfghanistanAlbaniaAlgeriaAndorraAngolaAntigua and BarbudaArab WorldArgentinaArmeniaArubaAustraliaAustriaAzerbaijanBahamas, TheBahrainBangladeshBarbadosBelarusBelgiumBelizeBeninBermudaBhutanBoliviaBosnia and HerzegovinaBotswanaBrazilBrunei DarussalamBulgariaBurkina FasoBurundiCabo VerdeCambodiaCameroonCanadaCaribbean small statesCayman IslandsCentral African RepublicCentral Europe and the BalticsChadChileChinaColombiaComorosCongo, Dem. Rep.Congo, Rep.Costa RicaCote d'IvoireCroatiaCubaCyprusCzech RepublicDenmarkDjiboutiDominicaDominican RepublicEarly-demographic dividendEast Asia & PacificEast Asia & Pacific (excluding high income)East Asia & Pacific (IDA & IBRD countries)EcuadorEgypt, Arab Rep.El SalvadorEquatorial GuineaEritreaEstoniaEthiopiaEuro areaEurope & Central AsiaEurope & Central Asia (excluding high income)Europe & Central Asia (IDA & IBRD countries)European UnionFaroe IslandsFijiFinlandFragile and conflict affected situationsFranceFrench PolynesiaGabonGambia, TheGeorgiaGermanyGhanaGreeceGreenlandGrenadaGuatemalaGuineaGuinea-BissauGuyanaHaitiHeavily indebted poor countries (HIPC)High incomeHondurasHong Kong SAR, ChinaHungaryIBRD onlyIcelandIDA & IBRD totalIDA blendIDA onlyIDA totalIndiaIndonesiaIran, Islamic Rep.IraqIrelandIsraelItalyJamaicaJapanJordanKazakhstanKenyaKiribatiKorea, Rep.KuwaitKyrgyz RepublicLao PDRLate-demographic dividendLatin America & Caribbean Latin America & Caribbean (excluding high income)Latin America & the Caribbean (IDA & IBRD countries)LatviaLeast developed countries: UN classificationLebanonLesothoLiberiaLibyaLithuaniaLow & middle incomeLower middle incomeLuxembourgMacao SAR, ChinaMacedonia, FYRMadagascarMalawiMalaysiaMaldivesMaliMaltaMauritaniaMauritiusMexicoMiddle East & North AfricaMiddle East & North Africa (excluding high income)Middle East & North Africa (IDA & IBRD countries)Middle incomeMoldovaMongoliaMoroccoMozambiqueMyanmarNamibiaNepalNetherlandsNew CaledoniaNew ZealandNicaraguaNigerNigeriaNorth AmericaNorwayOECD membersOmanOther small statesPacific island small statesPakistanPalauPanamaPapua New GuineaParaguayPeruPhilippinesPolandPortugalPost-demographic dividendPre-demographic dividendQatarRomaniaRussian FederationRwandaSamoaSao Tome and PrincipeSaudi ArabiaSenegalSerbiaSeychellesSierra LeoneSingaporeSlovak RepublicSloveniaSmall statesSolomon IslandsSomaliaSouth AfricaSouth AsiaSouth Asia (IDA & IBRD)SpainSri LankaSt. Kitts and NevisSt. LuciaSt. Vincent and the GrenadinesSub-Saharan Africa Sub-Saharan Africa (excluding high income)Sub-Saharan Africa (IDA & IBRD countries)SudanSurinameSwazilandSwedenSwitzerlandSyrian Arab RepublicTajikistanTanzaniaThailandTimor-LesteTogoTongaTrinidad and TobagoTunisiaTurkeyTurkmenistanTurks and Caicos IslandsTuvaluUgandaUkraineUnited Arab EmiratesUnited KingdomUnited StatesUpper middle incomeUruguayVanuatuVenezuela, RBVietnamVirgin Islands (U.S.)WorldYemen, Rep.ZambiaZimbabwe Timeline:
This timeline shows a graph from 1963 to 2016 of Denmark. No data until 1962. Number of actual observations by date: 54.
Source name:
World Development Indicators
Source organization:
World Bank staff estimates from the Comtrade database maintained by the United Nations Statistics Division.
Categories, topics:
Agriculture & Rural Development, Private Sector, Trade
Last updated:
apr 23, 2017
Indicators value changes by year
At the date of observation
Value
Absolute change
Change from previous value
jan 1, 1963
5.32
+5.32
0.0%
jan 1, 1964
5.2
-0.12
-2.26%
jan 1, 1965
5.681
+0.482
9.26%
jan 1, 1966
5.836
+0.155
2.73%
jan 1, 1967
6.133
+0.296
5.08%
jan 1, 1968
5.453
-0.68
-11.08%
jan 1, 1969
6.221
+0.768
14.08%
jan 1, 1970
5.756
-0.465
-7.47%
jan 1, 1971
5.334
-0.422
-7.33%
jan 1, 1972
5.078
-0.256
-4.8%
jan 1, 1973
5.438
+0.361
7.1%
jan 1, 1974
5.411
-0.027
-0.5%
jan 1, 1975
4.809
-0.603
-11.14%
jan 1, 1976
4.108
-0.701
-14.57%
jan 1, 1977
4.714
+0.606
14.76%
jan 1, 1978
5.011
+0.296
6.28%
jan 1, 1979
5.056
+0.045
0.9%
jan 1, 1980
5.836
+0.78
15.43%
jan 1, 1981
5.303
-0.532
-9.12%
jan 1, 1982
5.33
+0.026
0.5%
jan 1, 1983
5.636
+0.306
5.74%
jan 1, 1984
5.09
-0.545
-9.68%
jan 1, 1985
4.398
-0.693
-13.61%
jan 1, 1986
4.459
+0.061
1.39%
jan 1, 1987
4.559
+0.1
2.25%
jan 1, 1988
5.331
+0.772
16.94%
jan 1, 1989
4.674
-0.657
-12.33%
jan 1, 1990
4.139
-0.535
-11.44%
jan 1, 1991
3.379
-0.76
-18.37%
jan 1, 1992
3.444
+0.066
1.95%
jan 1, 1993
3.209
-0.236
-6.84%
jan 1, 1994
2.856
-0.352
-10.98%
jan 1, 1995
2.851
-0.006
-0.2%
jan 1, 1996
2.866
+0.016
0.55%
jan 1, 1997
3.065
+0.198
6.92%
jan 1, 1998
3.05
-0.015
-0.49%
jan 1, 1999
2.823
-0.227
-7.43%
jan 1, 2000
2.581
-0.242
-8.57%
jan 1, 2001
2.513
-0.068
-2.62%
jan 1, 2002
2.572
+0.059
2.33%
jan 1, 2003
2.86
+0.288
11.19%
jan 1, 2004
2.825
-0.035
-1.22%
jan 1, 2005
2.752
-0.073
-2.59%
jan 1, 2006
2.549
-0.203
-7.37%
jan 1, 2007
2.751
+0.202
7.93%
jan 1, 2008
2.273
-0.478
-17.38%
jan 1, 2009
2.233
-0.04
-1.75%
jan 1, 2010
2.385
+0.152
6.81%
jan 1, 2011
2.901
+0.516
21.62%
jan 1, 2012
2.942
+0.041
1.4%
jan 1, 2013
3.241
+0.299
10.16%
jan 1, 2014
3.551
+0.311
9.59%
jan 1, 2015
2.704
-0.848
-23.87%
jan 1, 2016
3.097
+0.393
14.54%
Ranking of countries by current statistics by years


Comments: