29
/
en
AIzaSyAYiBZKx7MnpbEhh9jyipgxe19OcubqV5w
April 1, 2024
51656
North America
NAC
false
2
1
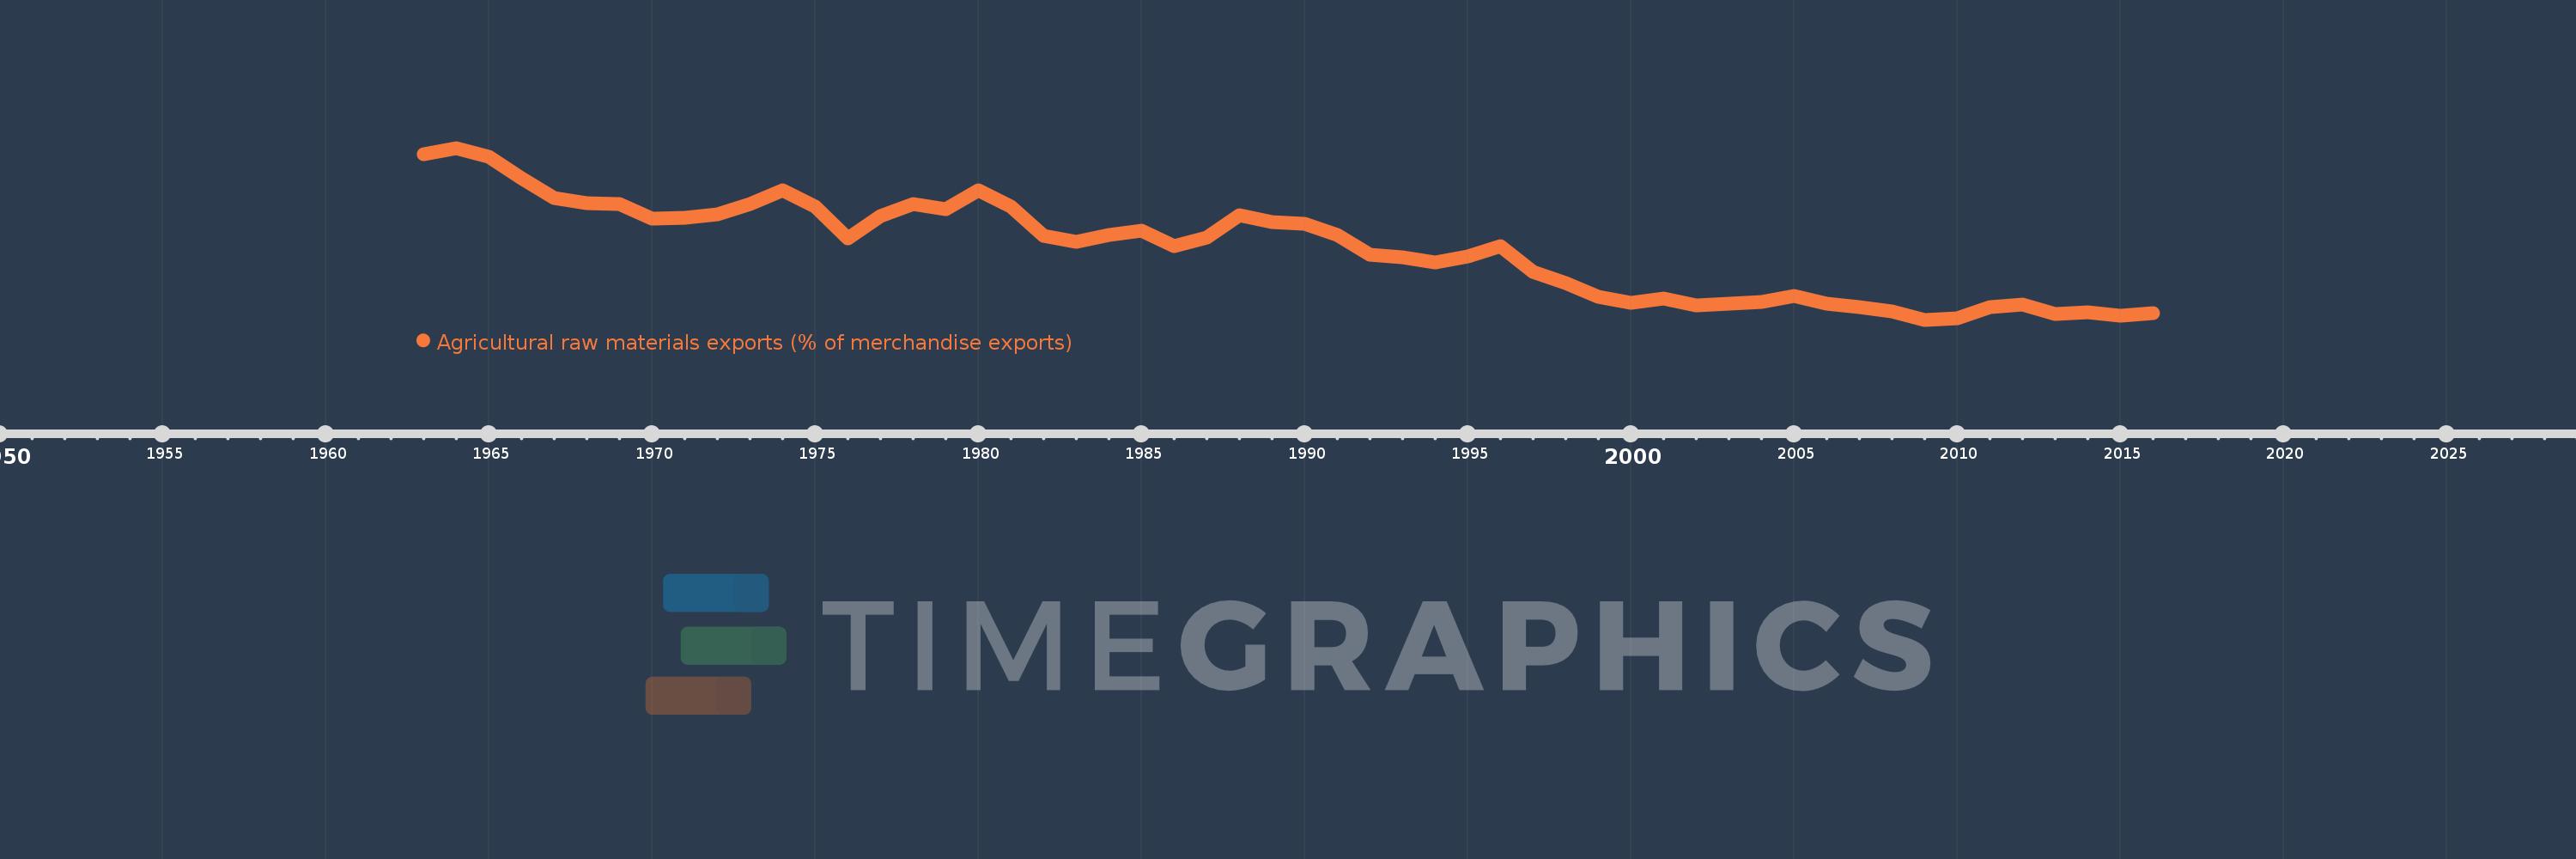
Agricultural raw materials exports (% of merchandise exports)
2016,2015,2014,2013,2012,2011,2010,2009,2008,2007,2006,2005,2004,2003,2002,2001,2000,1999,1998,1997,1996,1995,1994,1993,1992,1991,1990,1989,1988,1987,1986,1985,1984,1983,1982,1981,1980,1979,1978,1977,1976,1975,1974,1973,1972,1971,1970,1969,1968,1967,1966,1965,1964,1963
This statistics in other country:
AfghanistanAlbaniaAlgeriaAndorraAngolaAntigua and BarbudaArab WorldArgentinaArmeniaArubaAustraliaAustriaAzerbaijanBahamas, TheBahrainBangladeshBarbadosBelarusBelgiumBelizeBeninBermudaBhutanBoliviaBosnia and HerzegovinaBotswanaBrazilBrunei DarussalamBulgariaBurkina FasoBurundiCabo VerdeCambodiaCameroonCanadaCaribbean small statesCayman IslandsCentral African RepublicCentral Europe and the BalticsChadChileChinaColombiaComorosCongo, Dem. Rep.Congo, Rep.Costa RicaCote d'IvoireCroatiaCubaCyprusCzech RepublicDenmarkDjiboutiDominicaDominican RepublicEarly-demographic dividendEast Asia & PacificEast Asia & Pacific (excluding high income)East Asia & Pacific (IDA & IBRD countries)EcuadorEgypt, Arab Rep.El SalvadorEquatorial GuineaEritreaEstoniaEthiopiaEuro areaEurope & Central AsiaEurope & Central Asia (excluding high income)Europe & Central Asia (IDA & IBRD countries)European UnionFaroe IslandsFijiFinlandFragile and conflict affected situationsFranceFrench PolynesiaGabonGambia, TheGeorgiaGermanyGhanaGreeceGreenlandGrenadaGuatemalaGuineaGuinea-BissauGuyanaHaitiHeavily indebted poor countries (HIPC)High incomeHondurasHong Kong SAR, ChinaHungaryIBRD onlyIcelandIDA & IBRD totalIDA blendIDA onlyIDA totalIndiaIndonesiaIran, Islamic Rep.IraqIrelandIsraelItalyJamaicaJapanJordanKazakhstanKenyaKiribatiKorea, Rep.KuwaitKyrgyz RepublicLao PDRLate-demographic dividendLatin America & Caribbean Latin America & Caribbean (excluding high income)Latin America & the Caribbean (IDA & IBRD countries)LatviaLeast developed countries: UN classificationLebanonLesothoLiberiaLibyaLithuaniaLow & middle incomeLower middle incomeLuxembourgMacao SAR, ChinaMacedonia, FYRMadagascarMalawiMalaysiaMaldivesMaliMaltaMauritaniaMauritiusMexicoMiddle East & North AfricaMiddle East & North Africa (excluding high income)Middle East & North Africa (IDA & IBRD countries)Middle incomeMoldovaMongoliaMoroccoMozambiqueMyanmarNamibiaNepalNetherlandsNew CaledoniaNew ZealandNicaraguaNigerNigeriaNorth AmericaNorwayOECD membersOmanOther small statesPacific island small statesPakistanPalauPanamaPapua New GuineaParaguayPeruPhilippinesPolandPortugalPost-demographic dividendPre-demographic dividendQatarRomaniaRussian FederationRwandaSamoaSao Tome and PrincipeSaudi ArabiaSenegalSerbiaSeychellesSierra LeoneSingaporeSlovak RepublicSloveniaSmall statesSolomon IslandsSomaliaSouth AfricaSouth AsiaSouth Asia (IDA & IBRD)SpainSri LankaSt. Kitts and NevisSt. LuciaSt. Vincent and the GrenadinesSub-Saharan Africa Sub-Saharan Africa (excluding high income)Sub-Saharan Africa (IDA & IBRD countries)SudanSurinameSwazilandSwedenSwitzerlandSyrian Arab RepublicTajikistanTanzaniaThailandTimor-LesteTogoTongaTrinidad and TobagoTunisiaTurkeyTurkmenistanTurks and Caicos IslandsTuvaluUgandaUkraineUnited Arab EmiratesUnited KingdomUnited StatesUpper middle incomeUruguayVanuatuVenezuela, RBVietnamVirgin Islands (U.S.)WorldYemen, Rep.ZambiaZimbabwe Timeline:
This timeline shows a graph from 1963 to 2016 of North America. No data until 1962. Number of actual observations by date: 54.
Source name:
World Development Indicators
Source organization:
World Bank staff estimates from the Comtrade database maintained by the United Nations Statistics Division.
Categories, topics:
Agriculture & Rural Development, Private Sector, Trade
Last updated:
apr 23, 2017
Indicators value changes by year
At the date of observation
Value
Absolute change
Change from previous value
jan 1, 1963
8.322
+8.322
0.0%
jan 1, 1964
8.554
+0.232
2.79%
jan 1, 1965
8.234
-0.32
-3.74%
jan 1, 1966
7.499
-0.735
-8.92%
jan 1, 1967
6.811
-0.689
-9.19%
jan 1, 1968
6.627
-0.184
-2.7%
jan 1, 1969
6.605
-0.021
-0.32%
jan 1, 1970
6.094
-0.512
-7.75%
jan 1, 1971
6.124
+0.031
0.5%
jan 1, 1972
6.229
+0.105
1.71%
jan 1, 1973
6.592
+0.363
5.82%
jan 1, 1974
7.081
+0.49
7.43%
jan 1, 1975
6.504
-0.577
-8.15%
jan 1, 1976
5.411
-1.093
-16.81%
jan 1, 1977
6.191
+0.78
14.42%
jan 1, 1978
6.602
+0.411
6.64%
jan 1, 1979
6.417
-0.185
-2.8%
jan 1, 1980
7.071
+0.654
10.19%
jan 1, 1981
6.508
-0.563
-7.96%
jan 1, 1982
5.505
-1.003
-15.41%
jan 1, 1983
5.282
-0.224
-4.07%
jan 1, 1984
5.523
+0.241
4.57%
jan 1, 1985
5.67
+0.148
2.67%
jan 1, 1986
5.146
-0.525
-9.25%
jan 1, 1987
5.416
+0.27
5.25%
jan 1, 1988
6.215
+0.799
14.74%
jan 1, 1989
5.983
-0.232
-3.73%
jan 1, 1990
5.914
-0.069
-1.15%
jan 1, 1991
5.506
-0.408
-6.89%
jan 1, 1992
4.837
-0.669
-12.16%
jan 1, 1993
4.73
-0.107
-2.21%
jan 1, 1994
4.568
-0.161
-3.41%
jan 1, 1995
4.773
+0.205
4.48%
jan 1, 1996
5.13
+0.356
7.47%
jan 1, 1997
4.225
-0.905
-17.64%
jan 1, 1998
3.834
-0.391
-9.25%
jan 1, 1999
3.372
-0.462
-12.05%
jan 1, 2000
3.163
-0.209
-6.2%
jan 1, 2001
3.304
+0.141
4.45%
jan 1, 2002
3.067
-0.237
-7.17%
jan 1, 2003
3.124
+0.057
1.85%
jan 1, 2004
3.197
+0.073
2.35%
jan 1, 2005
3.384
+0.187
5.84%
jan 1, 2006
3.114
-0.269
-7.96%
jan 1, 2007
2.996
-0.119
-3.81%
jan 1, 2008
2.856
-0.14
-4.68%
jan 1, 2009
2.565
-0.291
-10.18%
jan 1, 2010
2.613
+0.048
1.88%
jan 1, 2011
3.01
+0.397
15.19%
jan 1, 2012
3.089
+0.079
2.63%
jan 1, 2013
2.754
-0.335
-10.83%
jan 1, 2014
2.833
+0.078
2.84%
jan 1, 2015
2.705
-0.127
-4.5%
jan 1, 2016
2.805
+0.1
3.69%
Ranking of countries by current statistics by years


Comments: