29
/
en
AIzaSyAYiBZKx7MnpbEhh9jyipgxe19OcubqV5w
April 1, 2024
201215
Morocco
MAR
true
2
1
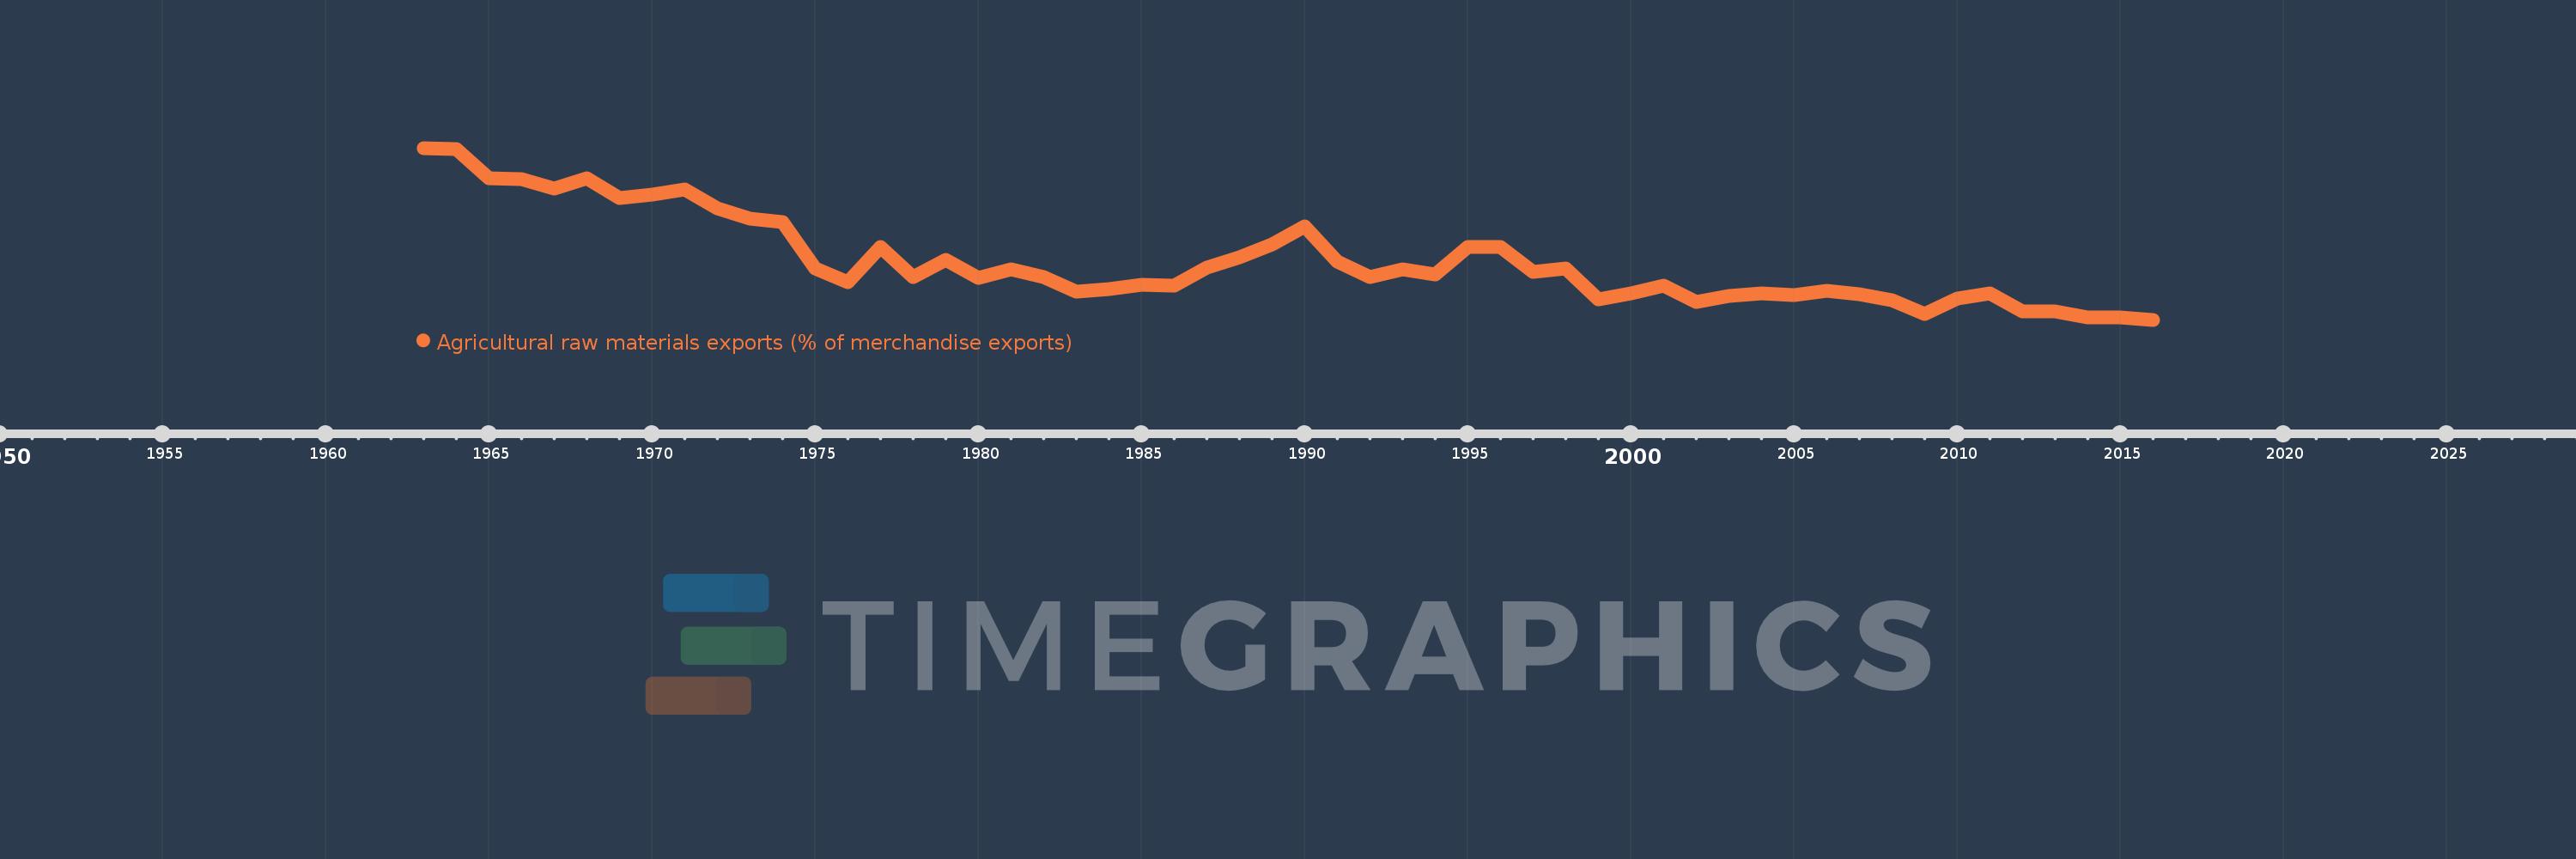
Agricultural raw materials exports (% of merchandise exports)
2016,2015,2014,2013,2012,2011,2010,2009,2008,2007,2006,2005,2004,2003,2002,2001,2000,1999,1998,1997,1996,1995,1994,1993,1992,1991,1990,1989,1988,1987,1986,1985,1984,1983,1982,1981,1980,1979,1978,1977,1976,1975,1974,1973,1972,1971,1970,1969,1968,1967,1966,1965,1964,1963
This statistics in other country:
AfghanistanAlbaniaAlgeriaAndorraAngolaAntigua and BarbudaArab WorldArgentinaArmeniaArubaAustraliaAustriaAzerbaijanBahamas, TheBahrainBangladeshBarbadosBelarusBelgiumBelizeBeninBermudaBhutanBoliviaBosnia and HerzegovinaBotswanaBrazilBrunei DarussalamBulgariaBurkina FasoBurundiCabo VerdeCambodiaCameroonCanadaCaribbean small statesCayman IslandsCentral African RepublicCentral Europe and the BalticsChadChileChinaColombiaComorosCongo, Dem. Rep.Congo, Rep.Costa RicaCote d'IvoireCroatiaCubaCyprusCzech RepublicDenmarkDjiboutiDominicaDominican RepublicEarly-demographic dividendEast Asia & PacificEast Asia & Pacific (excluding high income)East Asia & Pacific (IDA & IBRD countries)EcuadorEgypt, Arab Rep.El SalvadorEquatorial GuineaEritreaEstoniaEthiopiaEuro areaEurope & Central AsiaEurope & Central Asia (excluding high income)Europe & Central Asia (IDA & IBRD countries)European UnionFaroe IslandsFijiFinlandFragile and conflict affected situationsFranceFrench PolynesiaGabonGambia, TheGeorgiaGermanyGhanaGreeceGreenlandGrenadaGuatemalaGuineaGuinea-BissauGuyanaHaitiHeavily indebted poor countries (HIPC)High incomeHondurasHong Kong SAR, ChinaHungaryIBRD onlyIcelandIDA & IBRD totalIDA blendIDA onlyIDA totalIndiaIndonesiaIran, Islamic Rep.IraqIrelandIsraelItalyJamaicaJapanJordanKazakhstanKenyaKiribatiKorea, Rep.KuwaitKyrgyz RepublicLao PDRLate-demographic dividendLatin America & Caribbean Latin America & Caribbean (excluding high income)Latin America & the Caribbean (IDA & IBRD countries)LatviaLeast developed countries: UN classificationLebanonLesothoLiberiaLibyaLithuaniaLow & middle incomeLower middle incomeLuxembourgMacao SAR, ChinaMacedonia, FYRMadagascarMalawiMalaysiaMaldivesMaliMaltaMauritaniaMauritiusMexicoMiddle East & North AfricaMiddle East & North Africa (excluding high income)Middle East & North Africa (IDA & IBRD countries)Middle incomeMoldovaMongoliaMoroccoMozambiqueMyanmarNamibiaNepalNetherlandsNew CaledoniaNew ZealandNicaraguaNigerNigeriaNorth AmericaNorwayOECD membersOmanOther small statesPacific island small statesPakistanPalauPanamaPapua New GuineaParaguayPeruPhilippinesPolandPortugalPost-demographic dividendPre-demographic dividendQatarRomaniaRussian FederationRwandaSamoaSao Tome and PrincipeSaudi ArabiaSenegalSerbiaSeychellesSierra LeoneSingaporeSlovak RepublicSloveniaSmall statesSolomon IslandsSomaliaSouth AfricaSouth AsiaSouth Asia (IDA & IBRD)SpainSri LankaSt. Kitts and NevisSt. LuciaSt. Vincent and the GrenadinesSub-Saharan Africa Sub-Saharan Africa (excluding high income)Sub-Saharan Africa (IDA & IBRD countries)SudanSurinameSwazilandSwedenSwitzerlandSyrian Arab RepublicTajikistanTanzaniaThailandTimor-LesteTogoTongaTrinidad and TobagoTunisiaTurkeyTurkmenistanTurks and Caicos IslandsTuvaluUgandaUkraineUnited Arab EmiratesUnited KingdomUnited StatesUpper middle incomeUruguayVanuatuVenezuela, RBVietnamVirgin Islands (U.S.)WorldYemen, Rep.ZambiaZimbabwe Timeline:
This timeline shows a graph from 1963 to 2016 of Morocco. No data until 1962. Number of actual observations by date: 54.
Source name:
World Development Indicators
Source organization:
World Bank staff estimates from the Comtrade database maintained by the United Nations Statistics Division.
Categories, topics:
Agriculture & Rural Development, Private Sector, Trade
Last updated:
apr 23, 2017
Indicators value changes by year
At the date of observation
Value
Absolute change
Change from previous value
jan 1, 1963
7.025
+7.025
0.0%
jan 1, 1964
6.983
-0.042
-0.6%
jan 1, 1965
5.918
-1.065
-15.25%
jan 1, 1966
5.905
-0.013
-0.23%
jan 1, 1967
5.563
-0.342
-5.78%
jan 1, 1968
5.929
+0.365
6.56%
jan 1, 1969
5.2
-0.728
-12.28%
jan 1, 1970
5.344
+0.143
2.75%
jan 1, 1971
5.517
+0.174
3.25%
jan 1, 1972
4.841
-0.676
-12.26%
jan 1, 1973
4.475
-0.366
-7.55%
jan 1, 1974
4.338
-0.137
-3.07%
jan 1, 1975
2.656
-1.682
-38.78%
jan 1, 1976
2.145
-0.511
-19.25%
jan 1, 1977
3.419
+1.274
59.41%
jan 1, 1978
2.329
-1.09
-31.89%
jan 1, 1979
2.958
+0.63
27.05%
jan 1, 1980
2.324
-0.635
-21.46%
jan 1, 1981
2.622
+0.299
12.86%
jan 1, 1982
2.336
-0.286
-10.9%
jan 1, 1983
1.803
-0.534
-22.85%
jan 1, 1984
1.911
+0.108
5.99%
jan 1, 1985
2.064
+0.153
8.03%
jan 1, 1986
2.03
-0.034
-1.63%
jan 1, 1987
2.676
+0.646
31.8%
jan 1, 1988
3.044
+0.368
13.75%
jan 1, 1989
3.535
+0.491
16.13%
jan 1, 1990
4.19
+0.655
18.53%
jan 1, 1991
2.904
-1.286
-30.68%
jan 1, 1992
2.338
-0.567
-19.52%
jan 1, 1993
2.624
+0.286
12.24%
jan 1, 1994
2.441
-0.183
-6.97%
jan 1, 1995
3.422
+0.982
40.22%
jan 1, 1996
3.418
-0.004
-0.12%
jan 1, 1997
2.524
-0.895
-26.17%
jan 1, 1998
2.644
+0.121
4.78%
jan 1, 1999
1.543
-1.101
-41.64%
jan 1, 2000
1.748
+0.204
13.23%
jan 1, 2001
2.017
+0.269
15.39%
jan 1, 2002
1.422
-0.594
-29.48%
jan 1, 2003
1.639
+0.217
15.23%
jan 1, 2004
1.758
+0.119
7.28%
jan 1, 2005
1.67
-0.088
-5.02%
jan 1, 2006
1.837
+0.167
10.02%
jan 1, 2007
1.713
-0.124
-6.75%
jan 1, 2008
1.502
-0.212
-12.36%
jan 1, 2009
0.993
-0.509
-33.87%
jan 1, 2010
1.556
+0.563
56.69%
jan 1, 2011
1.734
+0.179
11.47%
jan 1, 2012
1.105
-0.629
-36.27%
jan 1, 2013
1.103
-0.002
-0.22%
jan 1, 2014
0.871
-0.232
-21.0%
jan 1, 2015
0.89
+0.019
2.12%
jan 1, 2016
0.791
-0.098
-11.05%
Ranking of countries by current statistics by years


Comments: