29
/
en
AIzaSyAYiBZKx7MnpbEhh9jyipgxe19OcubqV5w
April 1, 2024
153280
Iceland
ISL
true
2
1
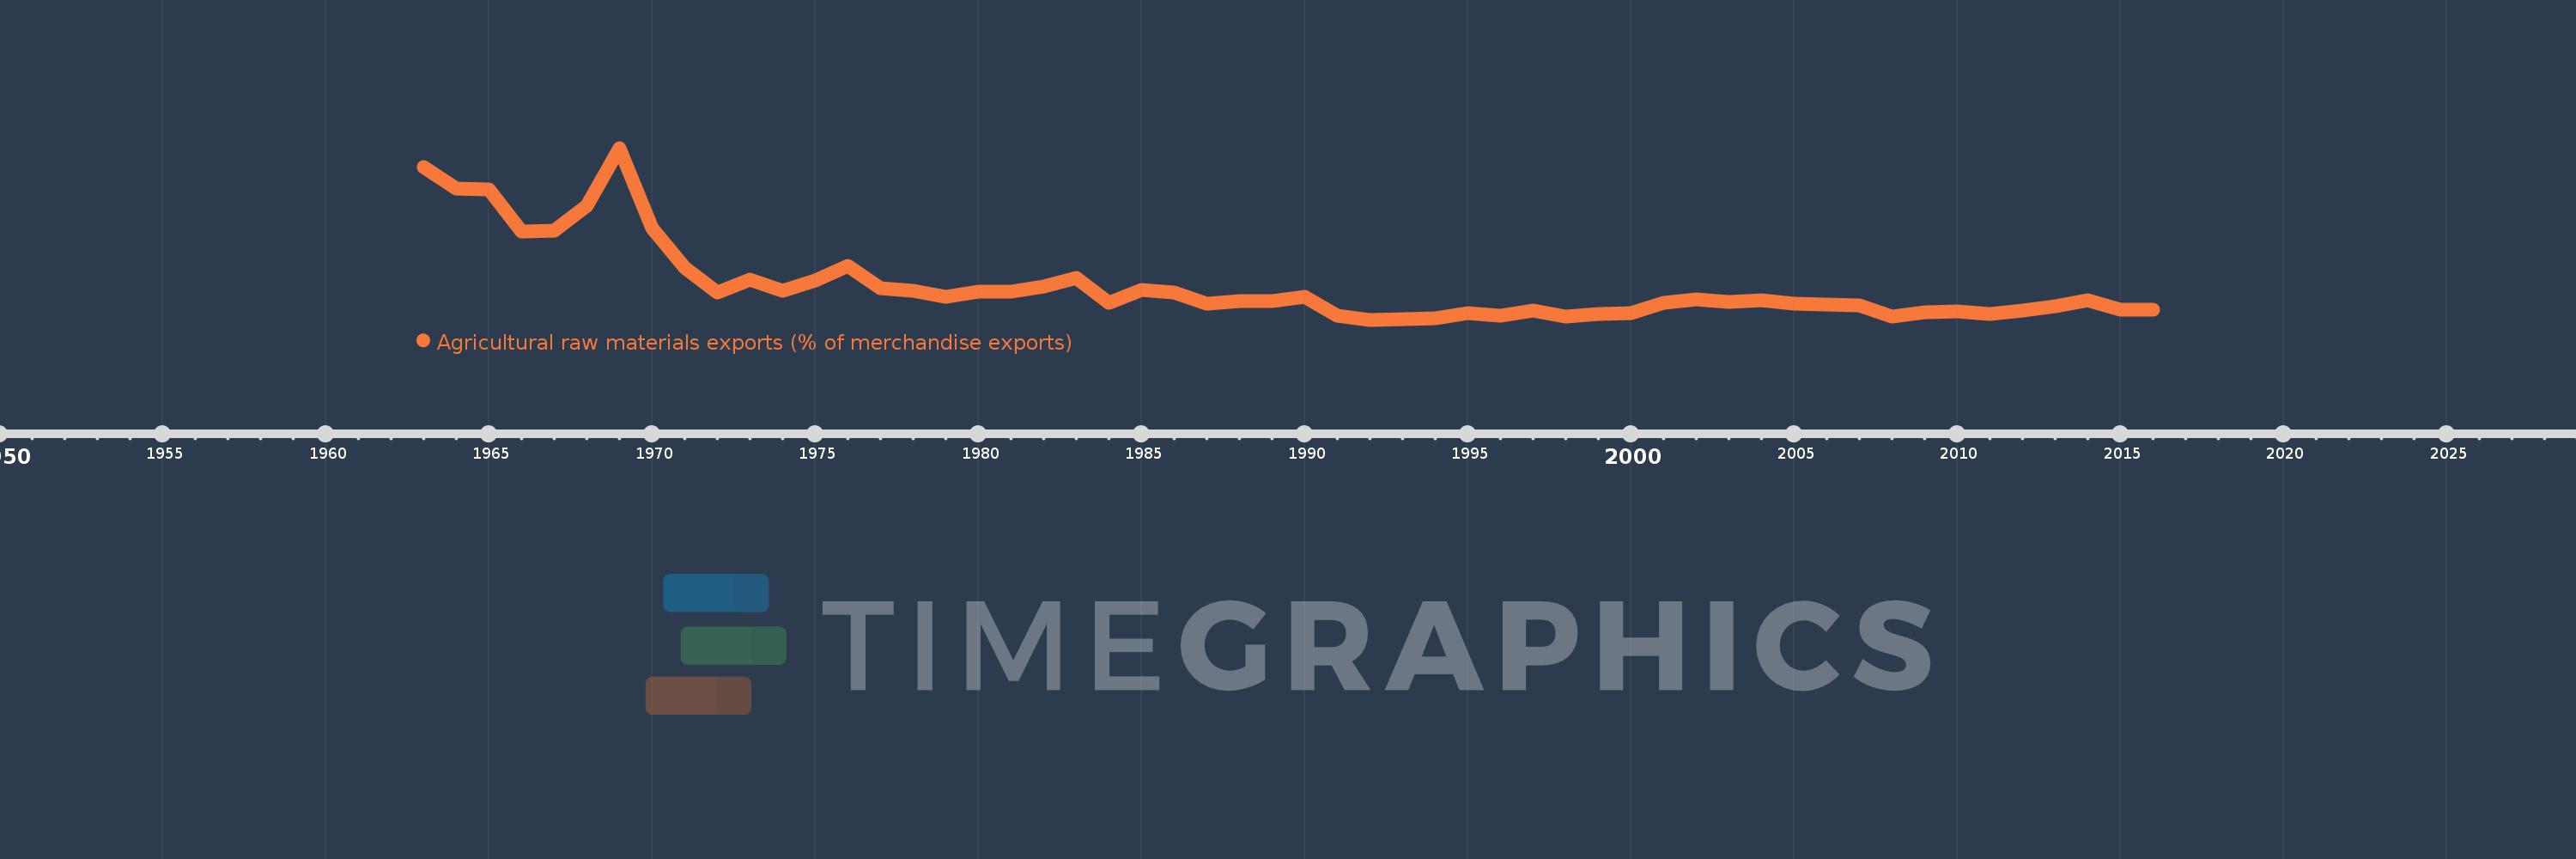
Agricultural raw materials exports (% of merchandise exports)
2016,2015,2014,2013,2012,2011,2010,2009,2008,2007,2006,2005,2004,2003,2002,2001,2000,1999,1998,1997,1996,1995,1994,1993,1992,1991,1990,1989,1988,1987,1986,1985,1984,1983,1982,1981,1980,1979,1978,1977,1976,1975,1974,1973,1972,1971,1970,1969,1968,1967,1966,1965,1964,1963
This statistics in other country:
AfghanistanAlbaniaAlgeriaAndorraAngolaAntigua and BarbudaArab WorldArgentinaArmeniaArubaAustraliaAustriaAzerbaijanBahamas, TheBahrainBangladeshBarbadosBelarusBelgiumBelizeBeninBermudaBhutanBoliviaBosnia and HerzegovinaBotswanaBrazilBrunei DarussalamBulgariaBurkina FasoBurundiCabo VerdeCambodiaCameroonCanadaCaribbean small statesCayman IslandsCentral African RepublicCentral Europe and the BalticsChadChileChinaColombiaComorosCongo, Dem. Rep.Congo, Rep.Costa RicaCote d'IvoireCroatiaCubaCyprusCzech RepublicDenmarkDjiboutiDominicaDominican RepublicEarly-demographic dividendEast Asia & PacificEast Asia & Pacific (excluding high income)East Asia & Pacific (IDA & IBRD countries)EcuadorEgypt, Arab Rep.El SalvadorEquatorial GuineaEritreaEstoniaEthiopiaEuro areaEurope & Central AsiaEurope & Central Asia (excluding high income)Europe & Central Asia (IDA & IBRD countries)European UnionFaroe IslandsFijiFinlandFragile and conflict affected situationsFranceFrench PolynesiaGabonGambia, TheGeorgiaGermanyGhanaGreeceGreenlandGrenadaGuatemalaGuineaGuinea-BissauGuyanaHaitiHeavily indebted poor countries (HIPC)High incomeHondurasHong Kong SAR, ChinaHungaryIBRD onlyIcelandIDA & IBRD totalIDA blendIDA onlyIDA totalIndiaIndonesiaIran, Islamic Rep.IraqIrelandIsraelItalyJamaicaJapanJordanKazakhstanKenyaKiribatiKorea, Rep.KuwaitKyrgyz RepublicLao PDRLate-demographic dividendLatin America & Caribbean Latin America & Caribbean (excluding high income)Latin America & the Caribbean (IDA & IBRD countries)LatviaLeast developed countries: UN classificationLebanonLesothoLiberiaLibyaLithuaniaLow & middle incomeLower middle incomeLuxembourgMacao SAR, ChinaMacedonia, FYRMadagascarMalawiMalaysiaMaldivesMaliMaltaMauritaniaMauritiusMexicoMiddle East & North AfricaMiddle East & North Africa (excluding high income)Middle East & North Africa (IDA & IBRD countries)Middle incomeMoldovaMongoliaMoroccoMozambiqueMyanmarNamibiaNepalNetherlandsNew CaledoniaNew ZealandNicaraguaNigerNigeriaNorth AmericaNorwayOECD membersOmanOther small statesPacific island small statesPakistanPalauPanamaPapua New GuineaParaguayPeruPhilippinesPolandPortugalPost-demographic dividendPre-demographic dividendQatarRomaniaRussian FederationRwandaSamoaSao Tome and PrincipeSaudi ArabiaSenegalSerbiaSeychellesSierra LeoneSingaporeSlovak RepublicSloveniaSmall statesSolomon IslandsSomaliaSouth AfricaSouth AsiaSouth Asia (IDA & IBRD)SpainSri LankaSt. Kitts and NevisSt. LuciaSt. Vincent and the GrenadinesSub-Saharan Africa Sub-Saharan Africa (excluding high income)Sub-Saharan Africa (IDA & IBRD countries)SudanSurinameSwazilandSwedenSwitzerlandSyrian Arab RepublicTajikistanTanzaniaThailandTimor-LesteTogoTongaTrinidad and TobagoTunisiaTurkeyTurkmenistanTurks and Caicos IslandsTuvaluUgandaUkraineUnited Arab EmiratesUnited KingdomUnited StatesUpper middle incomeUruguayVanuatuVenezuela, RBVietnamVirgin Islands (U.S.)WorldYemen, Rep.ZambiaZimbabwe Timeline:
This timeline shows a graph from 1963 to 2016 of Iceland. No data until 1962. Number of actual observations by date: 54.
Source name:
World Development Indicators
Source organization:
World Bank staff estimates from the Comtrade database maintained by the United Nations Statistics Division.
Categories, topics:
Agriculture & Rural Development, Private Sector, Trade
Last updated:
apr 23, 2017
Indicators value changes by year
At the date of observation
Value
Absolute change
Change from previous value
jan 1, 1963
4.741
+4.741
0.0%
jan 1, 1964
4.116
-0.625
-13.19%
jan 1, 1965
4.111
-0.004
-0.11%
jan 1, 1966
2.91
-1.201
-29.22%
jan 1, 1967
2.942
+0.032
1.09%
jan 1, 1968
3.637
+0.696
23.65%
jan 1, 1969
5.272
+1.635
44.95%
jan 1, 1970
2.999
-2.273
-43.11%
jan 1, 1971
1.902
-1.097
-36.59%
jan 1, 1972
1.181
-0.721
-37.92%
jan 1, 1973
1.551
+0.37
31.37%
jan 1, 1974
1.25
-0.301
-19.41%
jan 1, 1975
1.524
+0.274
21.91%
jan 1, 1976
1.952
+0.428
28.07%
jan 1, 1977
1.309
-0.643
-32.93%
jan 1, 1978
1.238
-0.071
-5.42%
jan 1, 1979
1.076
-0.162
-13.11%
jan 1, 1980
1.212
+0.136
12.67%
jan 1, 1981
1.218
+0.006
0.52%
jan 1, 1982
1.366
+0.148
12.15%
jan 1, 1983
1.599
+0.233
17.04%
jan 1, 1984
0.899
-0.7
-43.8%
jan 1, 1985
1.275
+0.376
41.84%
jan 1, 1986
1.192
-0.082
-6.47%
jan 1, 1987
0.864
-0.328
-27.52%
jan 1, 1988
0.944
+0.079
9.18%
jan 1, 1989
0.951
+0.007
0.78%
jan 1, 1990
1.073
+0.122
12.85%
jan 1, 1991
0.535
-0.538
-50.17%
jan 1, 1992
0.422
-0.113
-21.05%
jan 1, 1993
0.444
+0.021
5.06%
jan 1, 1994
0.472
+0.029
6.49%
jan 1, 1995
0.619
+0.146
30.95%
jan 1, 1996
0.545
-0.074
-11.89%
jan 1, 1997
0.67
+0.125
22.97%
jan 1, 1998
0.513
-0.158
-23.5%
jan 1, 1999
0.589
+0.076
14.85%
jan 1, 2000
0.619
+0.03
5.05%
jan 1, 2001
0.903
+0.284
45.96%
jan 1, 2002
0.995
+0.092
10.2%
jan 1, 2003
0.914
-0.081
-8.18%
jan 1, 2004
0.971
+0.057
6.27%
jan 1, 2005
0.886
-0.084
-8.7%
jan 1, 2006
0.845
-0.041
-4.67%
jan 1, 2007
0.817
-0.028
-3.28%
jan 1, 2008
0.503
-0.315
-38.5%
jan 1, 2009
0.635
+0.132
26.25%
jan 1, 2010
0.654
+0.019
3.01%
jan 1, 2011
0.582
-0.072
-10.99%
jan 1, 2012
0.678
+0.097
16.61%
jan 1, 2013
0.804
+0.126
18.51%
jan 1, 2014
0.972
+0.168
20.84%
jan 1, 2015
0.707
-0.264
-27.2%
jan 1, 2016
0.696
-0.011
-1.56%
Ranking of countries by current statistics by years


Comments: