29
/
en
AIzaSyAYiBZKx7MnpbEhh9jyipgxe19OcubqV5w
April 1, 2024
113220
Cote d'Ivoire
CIV
true
2
1
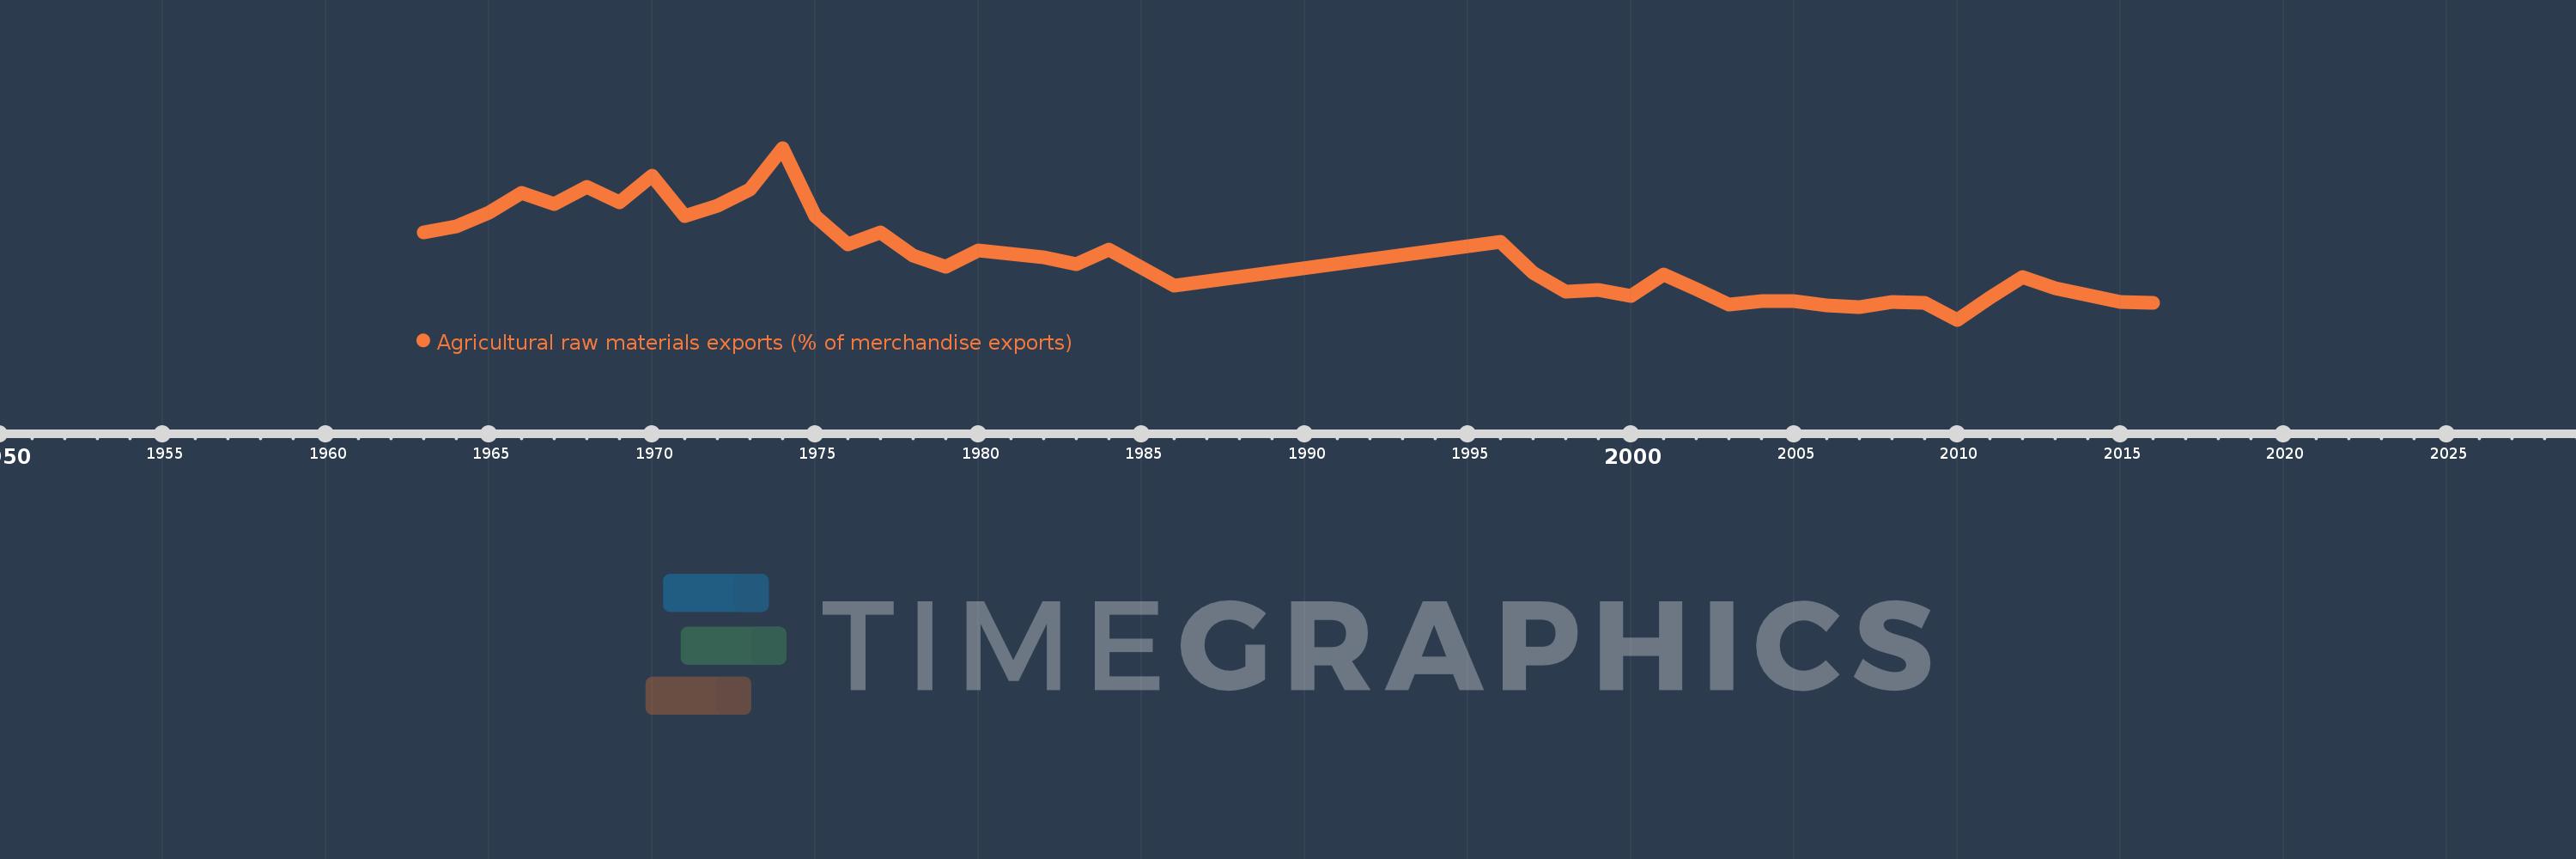
Agricultural raw materials exports (% of merchandise exports)
2016,2015,2014,2013,2012,2011,2010,2009,2008,2007,2006,2005,2004,2003,2002,2001,2000,1999,1998,1997,1996,1986,1984,1983,1982,1980,1979,1978,1977,1976,1975,1974,1973,1972,1971,1970,1969,1968,1967,1966,1965,1964,1963
This statistics in other country:
AfghanistanAlbaniaAlgeriaAndorraAngolaAntigua and BarbudaArab WorldArgentinaArmeniaArubaAustraliaAustriaAzerbaijanBahamas, TheBahrainBangladeshBarbadosBelarusBelgiumBelizeBeninBermudaBhutanBoliviaBosnia and HerzegovinaBotswanaBrazilBrunei DarussalamBulgariaBurkina FasoBurundiCabo VerdeCambodiaCameroonCanadaCaribbean small statesCayman IslandsCentral African RepublicCentral Europe and the BalticsChadChileChinaColombiaComorosCongo, Dem. Rep.Congo, Rep.Costa RicaCote d'IvoireCroatiaCubaCyprusCzech RepublicDenmarkDjiboutiDominicaDominican RepublicEarly-demographic dividendEast Asia & PacificEast Asia & Pacific (excluding high income)East Asia & Pacific (IDA & IBRD countries)EcuadorEgypt, Arab Rep.El SalvadorEquatorial GuineaEritreaEstoniaEthiopiaEuro areaEurope & Central AsiaEurope & Central Asia (excluding high income)Europe & Central Asia (IDA & IBRD countries)European UnionFaroe IslandsFijiFinlandFragile and conflict affected situationsFranceFrench PolynesiaGabonGambia, TheGeorgiaGermanyGhanaGreeceGreenlandGrenadaGuatemalaGuineaGuinea-BissauGuyanaHaitiHeavily indebted poor countries (HIPC)High incomeHondurasHong Kong SAR, ChinaHungaryIBRD onlyIcelandIDA & IBRD totalIDA blendIDA onlyIDA totalIndiaIndonesiaIran, Islamic Rep.IraqIrelandIsraelItalyJamaicaJapanJordanKazakhstanKenyaKiribatiKorea, Rep.KuwaitKyrgyz RepublicLao PDRLate-demographic dividendLatin America & Caribbean Latin America & Caribbean (excluding high income)Latin America & the Caribbean (IDA & IBRD countries)LatviaLeast developed countries: UN classificationLebanonLesothoLiberiaLibyaLithuaniaLow & middle incomeLower middle incomeLuxembourgMacao SAR, ChinaMacedonia, FYRMadagascarMalawiMalaysiaMaldivesMaliMaltaMauritaniaMauritiusMexicoMiddle East & North AfricaMiddle East & North Africa (excluding high income)Middle East & North Africa (IDA & IBRD countries)Middle incomeMoldovaMongoliaMoroccoMozambiqueMyanmarNamibiaNepalNetherlandsNew CaledoniaNew ZealandNicaraguaNigerNigeriaNorth AmericaNorwayOECD membersOmanOther small statesPacific island small statesPakistanPalauPanamaPapua New GuineaParaguayPeruPhilippinesPolandPortugalPost-demographic dividendPre-demographic dividendQatarRomaniaRussian FederationRwandaSamoaSao Tome and PrincipeSaudi ArabiaSenegalSerbiaSeychellesSierra LeoneSingaporeSlovak RepublicSloveniaSmall statesSolomon IslandsSomaliaSouth AfricaSouth AsiaSouth Asia (IDA & IBRD)SpainSri LankaSt. Kitts and NevisSt. LuciaSt. Vincent and the GrenadinesSub-Saharan Africa Sub-Saharan Africa (excluding high income)Sub-Saharan Africa (IDA & IBRD countries)SudanSurinameSwazilandSwedenSwitzerlandSyrian Arab RepublicTajikistanTanzaniaThailandTimor-LesteTogoTongaTrinidad and TobagoTunisiaTurkeyTurkmenistanTurks and Caicos IslandsTuvaluUgandaUkraineUnited Arab EmiratesUnited KingdomUnited StatesUpper middle incomeUruguayVanuatuVenezuela, RBVietnamVirgin Islands (U.S.)WorldYemen, Rep.ZambiaZimbabwe Timeline:
This timeline shows a graph from 1963 to 2016 of Cote d'Ivoire. No data until 1962. Number of actual observations by date: 43.
Source name:
World Development Indicators
Source organization:
World Bank staff estimates from the Comtrade database maintained by the United Nations Statistics Division.
Categories, topics:
Agriculture & Rural Development, Private Sector, Trade
Last updated:
apr 23, 2017
Indicators value changes by year
Maximum:
36.954
jan 1, 1974
At the date of observation
Value
Absolute change
Change from previous value
jan 1, 1963
21.51
+21.51
0.0%
jan 1, 1964
22.711
+1.201
5.58%
jan 1, 1965
25.221
+2.51
11.05%
jan 1, 1966
28.769
+3.548
14.07%
jan 1, 1967
26.734
-2.035
-7.07%
jan 1, 1968
29.815
+3.082
11.53%
jan 1, 1969
26.99
-2.826
-9.48%
jan 1, 1970
31.857
+4.867
18.03%
jan 1, 1971
24.623
-7.234
-22.71%
jan 1, 1972
26.462
+1.839
7.47%
jan 1, 1973
29.429
+2.967
11.21%
jan 1, 1974
36.954
+7.525
25.57%
jan 1, 1975
24.49
-12.464
-33.73%
jan 1, 1976
19.449
-5.041
-20.58%
jan 1, 1977
21.595
+2.146
11.04%
jan 1, 1978
17.332
-4.263
-19.74%
jan 1, 1979
15.31
-2.022
-11.66%
jan 1, 1980
18.316
+3.006
19.63%
jan 1, 1982
17.104
-1.212
-6.62%
jan 1, 1983
15.727
-1.377
-8.05%
jan 1, 1984
18.511
+2.784
17.7%
jan 1, 1986
11.859
-6.652
-35.94%
jan 1, 1996
19.884
+8.024
67.66%
jan 1, 1997
14.202
-5.681
-28.57%
jan 1, 1998
10.855
-3.347
-23.56%
jan 1, 1999
11.162
+0.307
2.83%
jan 1, 2000
10.031
-1.131
-10.14%
jan 1, 2001
13.965
+3.934
39.22%
jan 1, 2002
11.184
-2.781
-19.91%
jan 1, 2003
8.402
-2.783
-24.88%
jan 1, 2004
9.084
+0.682
8.12%
jan 1, 2005
9.029
-0.055
-0.61%
jan 1, 2006
8.273
-0.756
-8.37%
jan 1, 2007
8.023
-0.25
-3.03%
jan 1, 2008
8.865
+0.842
10.5%
jan 1, 2009
8.746
-0.119
-1.35%
jan 1, 2010
5.673
-3.073
-35.14%
jan 1, 2011
9.648
+3.976
70.09%
jan 1, 2012
13.453
+3.805
39.43%
jan 1, 2013
11.459
-1.994
-14.82%
jan 1, 2014
10.23
-1.229
-10.72%
jan 1, 2015
8.837
-1.393
-13.62%
jan 1, 2016
8.75
-0.087
-0.99%
Ranking of countries by current statistics by years


Comments: