29
/
en
AIzaSyAYiBZKx7MnpbEhh9jyipgxe19OcubqV5w
April 1, 2024
133834
France
FRA
true
2
1
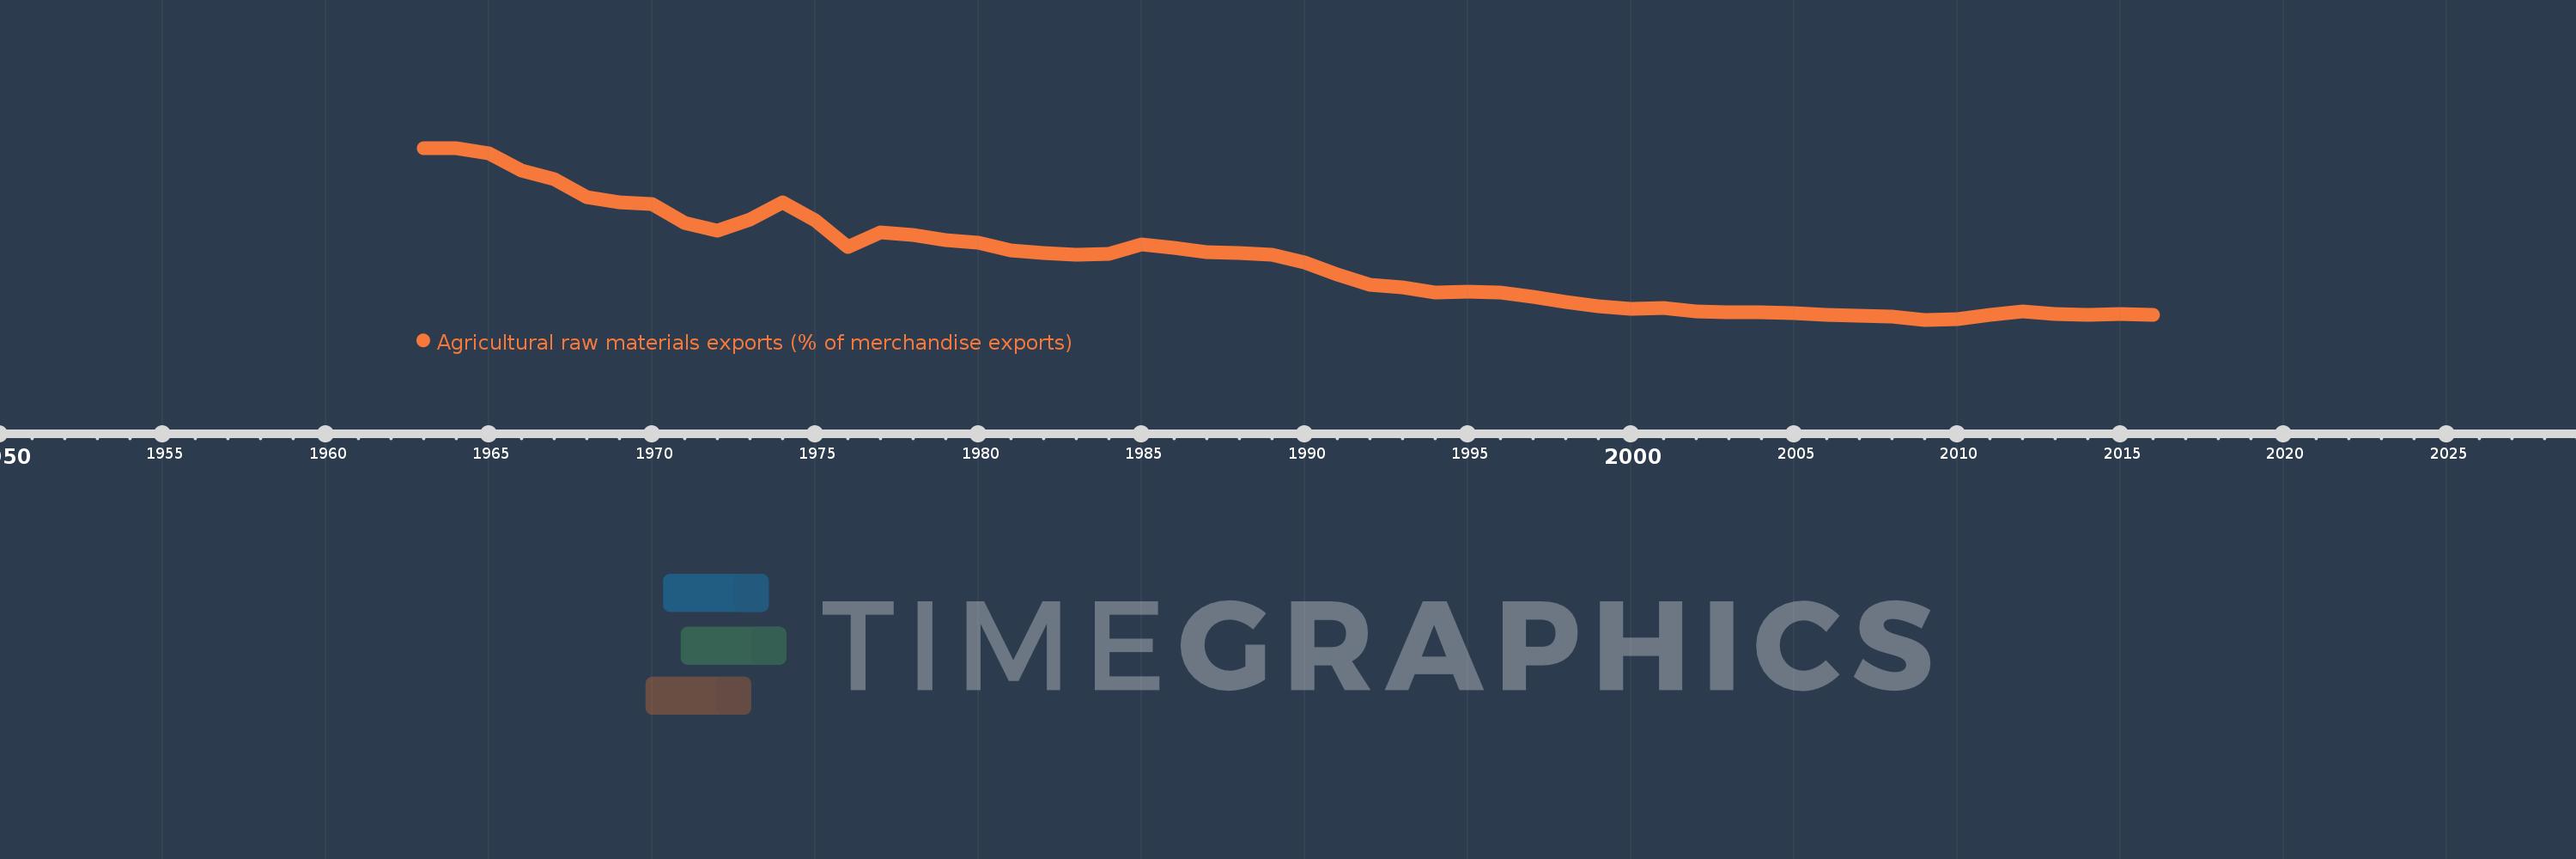
Agricultural raw materials exports (% of merchandise exports)
2016,2015,2014,2013,2012,2011,2010,2009,2008,2007,2006,2005,2004,2003,2002,2001,2000,1999,1998,1997,1996,1995,1994,1993,1992,1991,1990,1989,1988,1987,1986,1985,1984,1983,1982,1981,1980,1979,1978,1977,1976,1975,1974,1973,1972,1971,1970,1969,1968,1967,1966,1965,1964,1963
This statistics in other country:
AfghanistanAlbaniaAlgeriaAndorraAngolaAntigua and BarbudaArab WorldArgentinaArmeniaArubaAustraliaAustriaAzerbaijanBahamas, TheBahrainBangladeshBarbadosBelarusBelgiumBelizeBeninBermudaBhutanBoliviaBosnia and HerzegovinaBotswanaBrazilBrunei DarussalamBulgariaBurkina FasoBurundiCabo VerdeCambodiaCameroonCanadaCaribbean small statesCayman IslandsCentral African RepublicCentral Europe and the BalticsChadChileChinaColombiaComorosCongo, Dem. Rep.Congo, Rep.Costa RicaCote d'IvoireCroatiaCubaCyprusCzech RepublicDenmarkDjiboutiDominicaDominican RepublicEarly-demographic dividendEast Asia & PacificEast Asia & Pacific (excluding high income)East Asia & Pacific (IDA & IBRD countries)EcuadorEgypt, Arab Rep.El SalvadorEquatorial GuineaEritreaEstoniaEthiopiaEuro areaEurope & Central AsiaEurope & Central Asia (excluding high income)Europe & Central Asia (IDA & IBRD countries)European UnionFaroe IslandsFijiFinlandFragile and conflict affected situationsFranceFrench PolynesiaGabonGambia, TheGeorgiaGermanyGhanaGreeceGreenlandGrenadaGuatemalaGuineaGuinea-BissauGuyanaHaitiHeavily indebted poor countries (HIPC)High incomeHondurasHong Kong SAR, ChinaHungaryIBRD onlyIcelandIDA & IBRD totalIDA blendIDA onlyIDA totalIndiaIndonesiaIran, Islamic Rep.IraqIrelandIsraelItalyJamaicaJapanJordanKazakhstanKenyaKiribatiKorea, Rep.KuwaitKyrgyz RepublicLao PDRLate-demographic dividendLatin America & Caribbean Latin America & Caribbean (excluding high income)Latin America & the Caribbean (IDA & IBRD countries)LatviaLeast developed countries: UN classificationLebanonLesothoLiberiaLibyaLithuaniaLow & middle incomeLower middle incomeLuxembourgMacao SAR, ChinaMacedonia, FYRMadagascarMalawiMalaysiaMaldivesMaliMaltaMauritaniaMauritiusMexicoMiddle East & North AfricaMiddle East & North Africa (excluding high income)Middle East & North Africa (IDA & IBRD countries)Middle incomeMoldovaMongoliaMoroccoMozambiqueMyanmarNamibiaNepalNetherlandsNew CaledoniaNew ZealandNicaraguaNigerNigeriaNorth AmericaNorwayOECD membersOmanOther small statesPacific island small statesPakistanPalauPanamaPapua New GuineaParaguayPeruPhilippinesPolandPortugalPost-demographic dividendPre-demographic dividendQatarRomaniaRussian FederationRwandaSamoaSao Tome and PrincipeSaudi ArabiaSenegalSerbiaSeychellesSierra LeoneSingaporeSlovak RepublicSloveniaSmall statesSolomon IslandsSomaliaSouth AfricaSouth AsiaSouth Asia (IDA & IBRD)SpainSri LankaSt. Kitts and NevisSt. LuciaSt. Vincent and the GrenadinesSub-Saharan Africa Sub-Saharan Africa (excluding high income)Sub-Saharan Africa (IDA & IBRD countries)SudanSurinameSwazilandSwedenSwitzerlandSyrian Arab RepublicTajikistanTanzaniaThailandTimor-LesteTogoTongaTrinidad and TobagoTunisiaTurkeyTurkmenistanTurks and Caicos IslandsTuvaluUgandaUkraineUnited Arab EmiratesUnited KingdomUnited StatesUpper middle incomeUruguayVanuatuVenezuela, RBVietnamVirgin Islands (U.S.)WorldYemen, Rep.ZambiaZimbabwe Timeline:
This timeline shows a graph from 1963 to 2016 of France. No data until 1962. Number of actual observations by date: 54.
Source name:
World Development Indicators
Source organization:
World Bank staff estimates from the Comtrade database maintained by the United Nations Statistics Division.
Categories, topics:
Agriculture & Rural Development, Private Sector, Trade
Last updated:
apr 23, 2017
Indicators value changes by year
At the date of observation
Value
Absolute change
Change from previous value
jan 1, 1963
4.767
+4.767
0.0%
jan 1, 1964
4.754
-0.013
-0.28%
jan 1, 1965
4.651
-0.103
-2.16%
jan 1, 1966
4.243
-0.408
-8.77%
jan 1, 1967
4.052
-0.191
-4.51%
jan 1, 1968
3.645
-0.407
-10.04%
jan 1, 1969
3.518
-0.127
-3.47%
jan 1, 1970
3.487
-0.031
-0.87%
jan 1, 1971
3.054
-0.433
-12.41%
jan 1, 1972
2.87
-0.185
-6.04%
jan 1, 1973
3.118
+0.248
8.64%
jan 1, 1974
3.514
+0.396
12.71%
jan 1, 1975
3.096
-0.418
-11.89%
jan 1, 1976
2.502
-0.595
-19.21%
jan 1, 1977
2.819
+0.317
12.68%
jan 1, 1978
2.767
-0.052
-1.86%
jan 1, 1979
2.647
-0.119
-4.3%
jan 1, 1980
2.597
-0.05
-1.89%
jan 1, 1981
2.416
-0.181
-6.97%
jan 1, 1982
2.354
-0.063
-2.6%
jan 1, 1983
2.311
-0.042
-1.79%
jan 1, 1984
2.336
+0.025
1.08%
jan 1, 1985
2.551
+0.214
9.17%
jan 1, 1986
2.482
-0.069
-2.7%
jan 1, 1987
2.378
-0.104
-4.18%
jan 1, 1988
2.364
-0.014
-0.6%
jan 1, 1989
2.315
-0.049
-2.05%
jan 1, 1990
2.137
-0.178
-7.7%
jan 1, 1991
1.859
-0.278
-12.99%
jan 1, 1992
1.625
-0.234
-12.59%
jan 1, 1993
1.559
-0.066
-4.07%
jan 1, 1994
1.445
-0.114
-7.33%
jan 1, 1995
1.464
+0.019
1.29%
jan 1, 1996
1.456
-0.007
-0.51%
jan 1, 1997
1.353
-0.103
-7.08%
jan 1, 1998
1.227
-0.126
-9.32%
jan 1, 1999
1.128
-0.099
-8.06%
jan 1, 2000
1.079
-0.049
-4.35%
jan 1, 2001
1.091
+0.012
1.12%
jan 1, 2002
1.018
-0.073
-6.69%
jan 1, 2003
0.992
-0.026
-2.54%
jan 1, 2004
0.99
-0.002
-0.24%
jan 1, 2005
0.972
-0.018
-1.84%
jan 1, 2006
0.937
-0.035
-3.6%
jan 1, 2007
0.915
-0.021
-2.26%
jan 1, 2008
0.903
-0.013
-1.41%
jan 1, 2009
0.823
-0.079
-8.78%
jan 1, 2010
0.84
+0.017
2.04%
jan 1, 2011
0.933
+0.093
11.07%
jan 1, 2012
1.014
+0.081
8.66%
jan 1, 2013
0.953
-0.061
-6.03%
jan 1, 2014
0.944
-0.009
-0.94%
jan 1, 2015
0.955
+0.011
1.18%
jan 1, 2016
0.933
-0.022
-2.34%
Ranking of countries by current statistics by years


Comments: