29
/
en
AIzaSyAYiBZKx7MnpbEhh9jyipgxe19OcubqV5w
April 1, 2024
257032
Switzerland
CHE
true
2
1
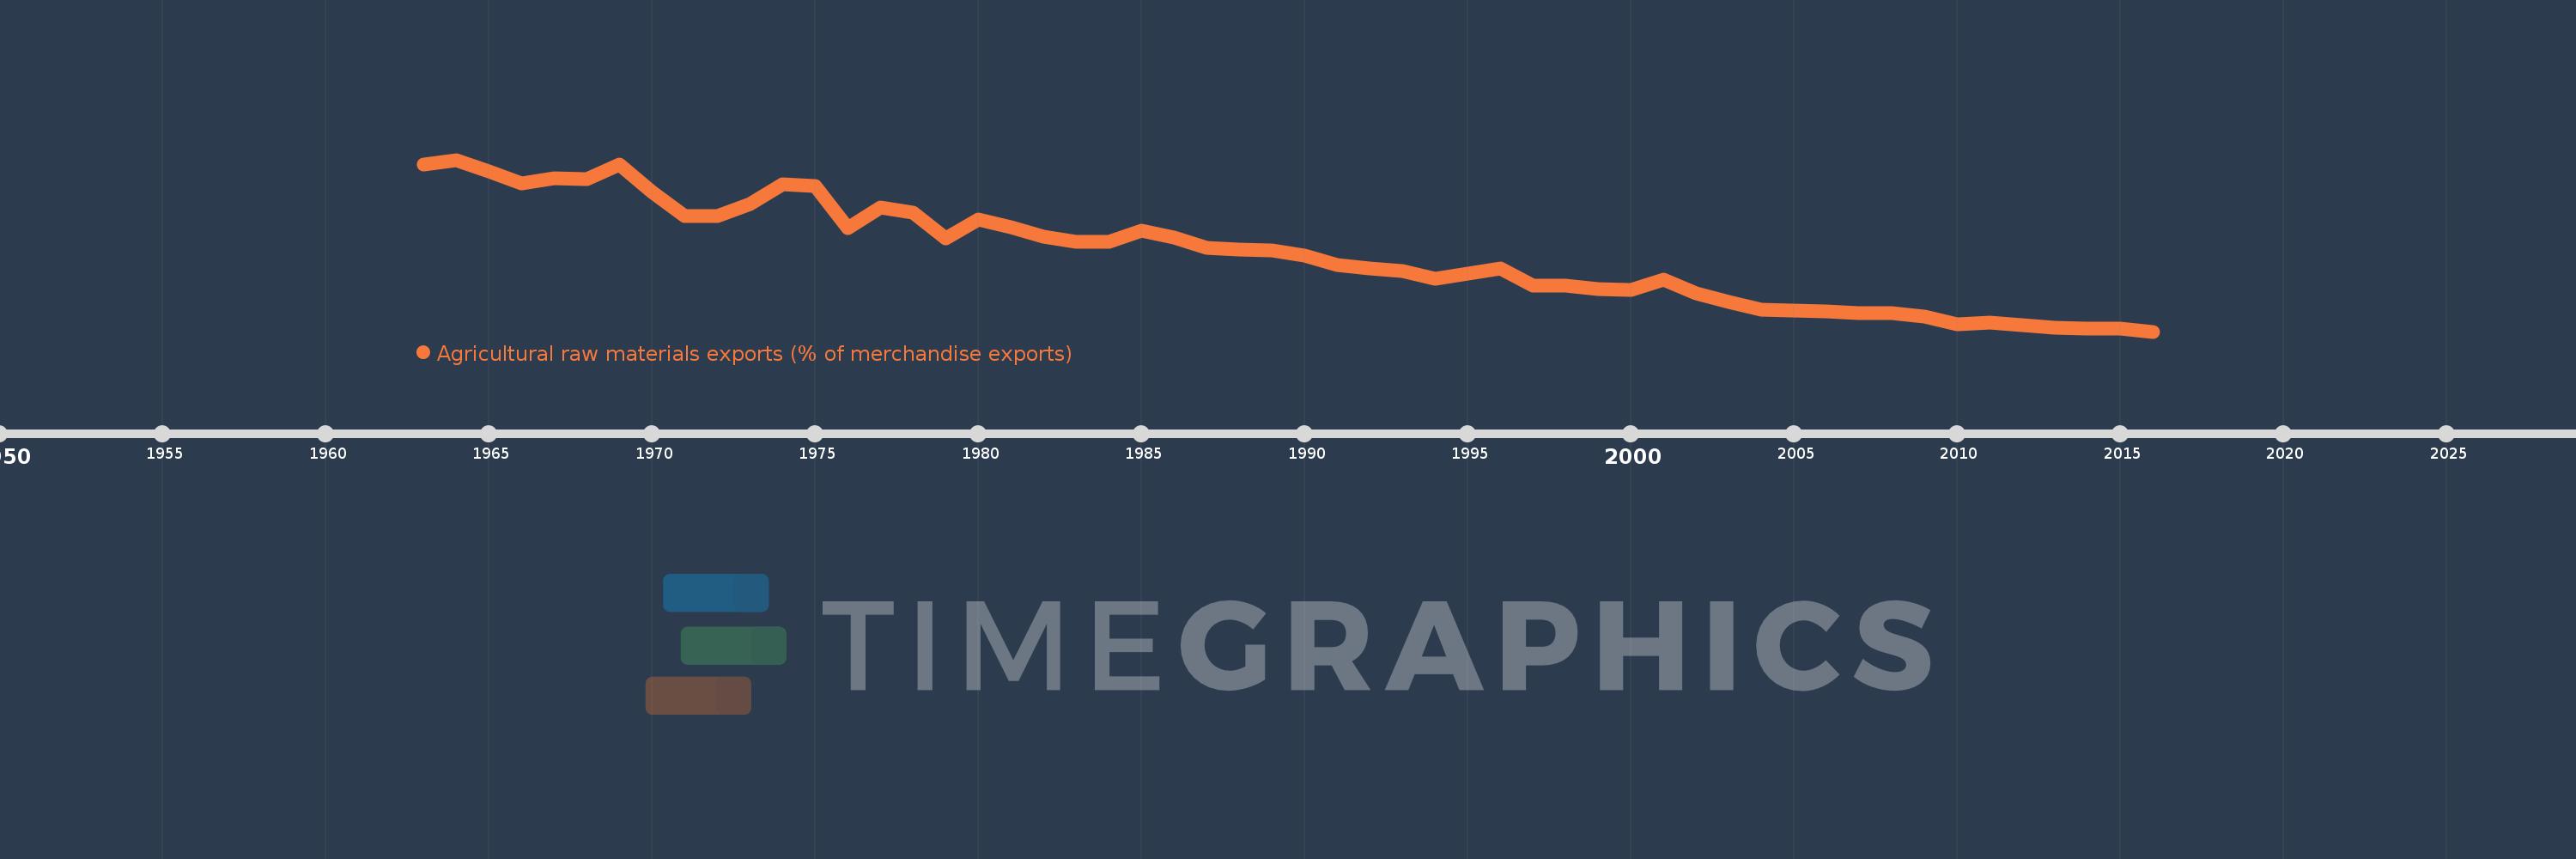
Agricultural raw materials exports (% of merchandise exports)
2016,2015,2014,2013,2012,2011,2010,2009,2008,2007,2006,2005,2004,2003,2002,2001,2000,1999,1998,1997,1996,1995,1994,1993,1992,1991,1990,1989,1988,1987,1986,1985,1984,1983,1982,1981,1980,1979,1978,1977,1976,1975,1974,1973,1972,1971,1970,1969,1968,1967,1966,1965,1964,1963
This statistics in other country:
AfghanistanAlbaniaAlgeriaAndorraAngolaAntigua and BarbudaArab WorldArgentinaArmeniaArubaAustraliaAustriaAzerbaijanBahamas, TheBahrainBangladeshBarbadosBelarusBelgiumBelizeBeninBermudaBhutanBoliviaBosnia and HerzegovinaBotswanaBrazilBrunei DarussalamBulgariaBurkina FasoBurundiCabo VerdeCambodiaCameroonCanadaCaribbean small statesCayman IslandsCentral African RepublicCentral Europe and the BalticsChadChileChinaColombiaComorosCongo, Dem. Rep.Congo, Rep.Costa RicaCote d'IvoireCroatiaCubaCyprusCzech RepublicDenmarkDjiboutiDominicaDominican RepublicEarly-demographic dividendEast Asia & PacificEast Asia & Pacific (excluding high income)East Asia & Pacific (IDA & IBRD countries)EcuadorEgypt, Arab Rep.El SalvadorEquatorial GuineaEritreaEstoniaEthiopiaEuro areaEurope & Central AsiaEurope & Central Asia (excluding high income)Europe & Central Asia (IDA & IBRD countries)European UnionFaroe IslandsFijiFinlandFragile and conflict affected situationsFranceFrench PolynesiaGabonGambia, TheGeorgiaGermanyGhanaGreeceGreenlandGrenadaGuatemalaGuineaGuinea-BissauGuyanaHaitiHeavily indebted poor countries (HIPC)High incomeHondurasHong Kong SAR, ChinaHungaryIBRD onlyIcelandIDA & IBRD totalIDA blendIDA onlyIDA totalIndiaIndonesiaIran, Islamic Rep.IraqIrelandIsraelItalyJamaicaJapanJordanKazakhstanKenyaKiribatiKorea, Rep.KuwaitKyrgyz RepublicLao PDRLate-demographic dividendLatin America & Caribbean Latin America & Caribbean (excluding high income)Latin America & the Caribbean (IDA & IBRD countries)LatviaLeast developed countries: UN classificationLebanonLesothoLiberiaLibyaLithuaniaLow & middle incomeLower middle incomeLuxembourgMacao SAR, ChinaMacedonia, FYRMadagascarMalawiMalaysiaMaldivesMaliMaltaMauritaniaMauritiusMexicoMiddle East & North AfricaMiddle East & North Africa (excluding high income)Middle East & North Africa (IDA & IBRD countries)Middle incomeMoldovaMongoliaMoroccoMozambiqueMyanmarNamibiaNepalNetherlandsNew CaledoniaNew ZealandNicaraguaNigerNigeriaNorth AmericaNorwayOECD membersOmanOther small statesPacific island small statesPakistanPalauPanamaPapua New GuineaParaguayPeruPhilippinesPolandPortugalPost-demographic dividendPre-demographic dividendQatarRomaniaRussian FederationRwandaSamoaSao Tome and PrincipeSaudi ArabiaSenegalSerbiaSeychellesSierra LeoneSingaporeSlovak RepublicSloveniaSmall statesSolomon IslandsSomaliaSouth AfricaSouth AsiaSouth Asia (IDA & IBRD)SpainSri LankaSt. Kitts and NevisSt. LuciaSt. Vincent and the GrenadinesSub-Saharan Africa Sub-Saharan Africa (excluding high income)Sub-Saharan Africa (IDA & IBRD countries)SudanSurinameSwazilandSwedenSwitzerlandSyrian Arab RepublicTajikistanTanzaniaThailandTimor-LesteTogoTongaTrinidad and TobagoTunisiaTurkeyTurkmenistanTurks and Caicos IslandsTuvaluUgandaUkraineUnited Arab EmiratesUnited KingdomUnited StatesUpper middle incomeUruguayVanuatuVenezuela, RBVietnamVirgin Islands (U.S.)WorldYemen, Rep.ZambiaZimbabwe Timeline:
This timeline shows a graph from 1963 to 2016 of Switzerland. No data until 1962. Number of actual observations by date: 54.
Source name:
World Development Indicators
Source organization:
World Bank staff estimates from the Comtrade database maintained by the United Nations Statistics Division.
Categories, topics:
Agriculture & Rural Development, Private Sector, Trade
Last updated:
apr 23, 2017
Indicators value changes by year
At the date of observation
Value
Absolute change
Change from previous value
jan 1, 1963
1.584
+1.584
0.0%
jan 1, 1964
1.624
+0.04
2.5%
jan 1, 1965
1.529
-0.095
-5.85%
jan 1, 1966
1.43
-0.099
-6.47%
jan 1, 1967
1.475
+0.045
3.18%
jan 1, 1968
1.469
-0.007
-0.47%
jan 1, 1969
1.584
+0.116
7.89%
jan 1, 1970
1.363
-0.221
-13.95%
jan 1, 1971
1.166
-0.197
-14.47%
jan 1, 1972
1.165
-0.001
-0.05%
jan 1, 1973
1.26
+0.094
8.08%
jan 1, 1974
1.425
+0.165
13.09%
jan 1, 1975
1.411
-0.014
-0.96%
jan 1, 1976
1.065
-0.346
-24.52%
jan 1, 1977
1.231
+0.166
15.61%
jan 1, 1978
1.193
-0.038
-3.11%
jan 1, 1979
0.982
-0.211
-17.7%
jan 1, 1980
1.138
+0.156
15.93%
jan 1, 1981
1.072
-0.066
-5.79%
jan 1, 1982
0.999
-0.073
-6.82%
jan 1, 1983
0.951
-0.048
-4.81%
jan 1, 1984
0.952
+0.001
0.08%
jan 1, 1985
1.046
+0.094
9.92%
jan 1, 1986
0.99
-0.056
-5.37%
jan 1, 1987
0.907
-0.083
-8.39%
jan 1, 1988
0.892
-0.015
-1.62%
jan 1, 1989
0.884
-0.008
-0.94%
jan 1, 1990
0.838
-0.046
-5.23%
jan 1, 1991
0.766
-0.072
-8.54%
jan 1, 1992
0.735
-0.031
-4.04%
jan 1, 1993
0.715
-0.02
-2.76%
jan 1, 1994
0.65
-0.065
-9.09%
jan 1, 1995
0.697
+0.047
7.22%
jan 1, 1996
0.734
+0.037
5.26%
jan 1, 1997
0.595
-0.139
-18.95%
jan 1, 1998
0.594
0.0
-0.08%
jan 1, 1999
0.564
-0.03
-5.01%
jan 1, 2000
0.558
-0.006
-1.09%
jan 1, 2001
0.643
+0.085
15.18%
jan 1, 2002
0.53
-0.113
-17.55%
jan 1, 2003
0.461
-0.069
-13.05%
jan 1, 2004
0.397
-0.064
-13.93%
jan 1, 2005
0.393
-0.003
-0.84%
jan 1, 2006
0.387
-0.006
-1.65%
jan 1, 2007
0.369
-0.018
-4.74%
jan 1, 2008
0.371
+0.002
0.57%
jan 1, 2009
0.342
-0.029
-7.73%
jan 1, 2010
0.283
-0.059
-17.2%
jan 1, 2011
0.295
+0.012
4.13%
jan 1, 2012
0.271
-0.024
-8.02%
jan 1, 2013
0.252
-0.02
-7.22%
jan 1, 2014
0.244
-0.008
-3.14%
jan 1, 2015
0.246
+0.002
0.8%
jan 1, 2016
0.22
-0.026
-10.42%
Ranking of countries by current statistics by years


Comments: