29
/
en
AIzaSyAYiBZKx7MnpbEhh9jyipgxe19OcubqV5w
April 1, 2024
266538
Trinidad and Tobago
TTO
true
2
1
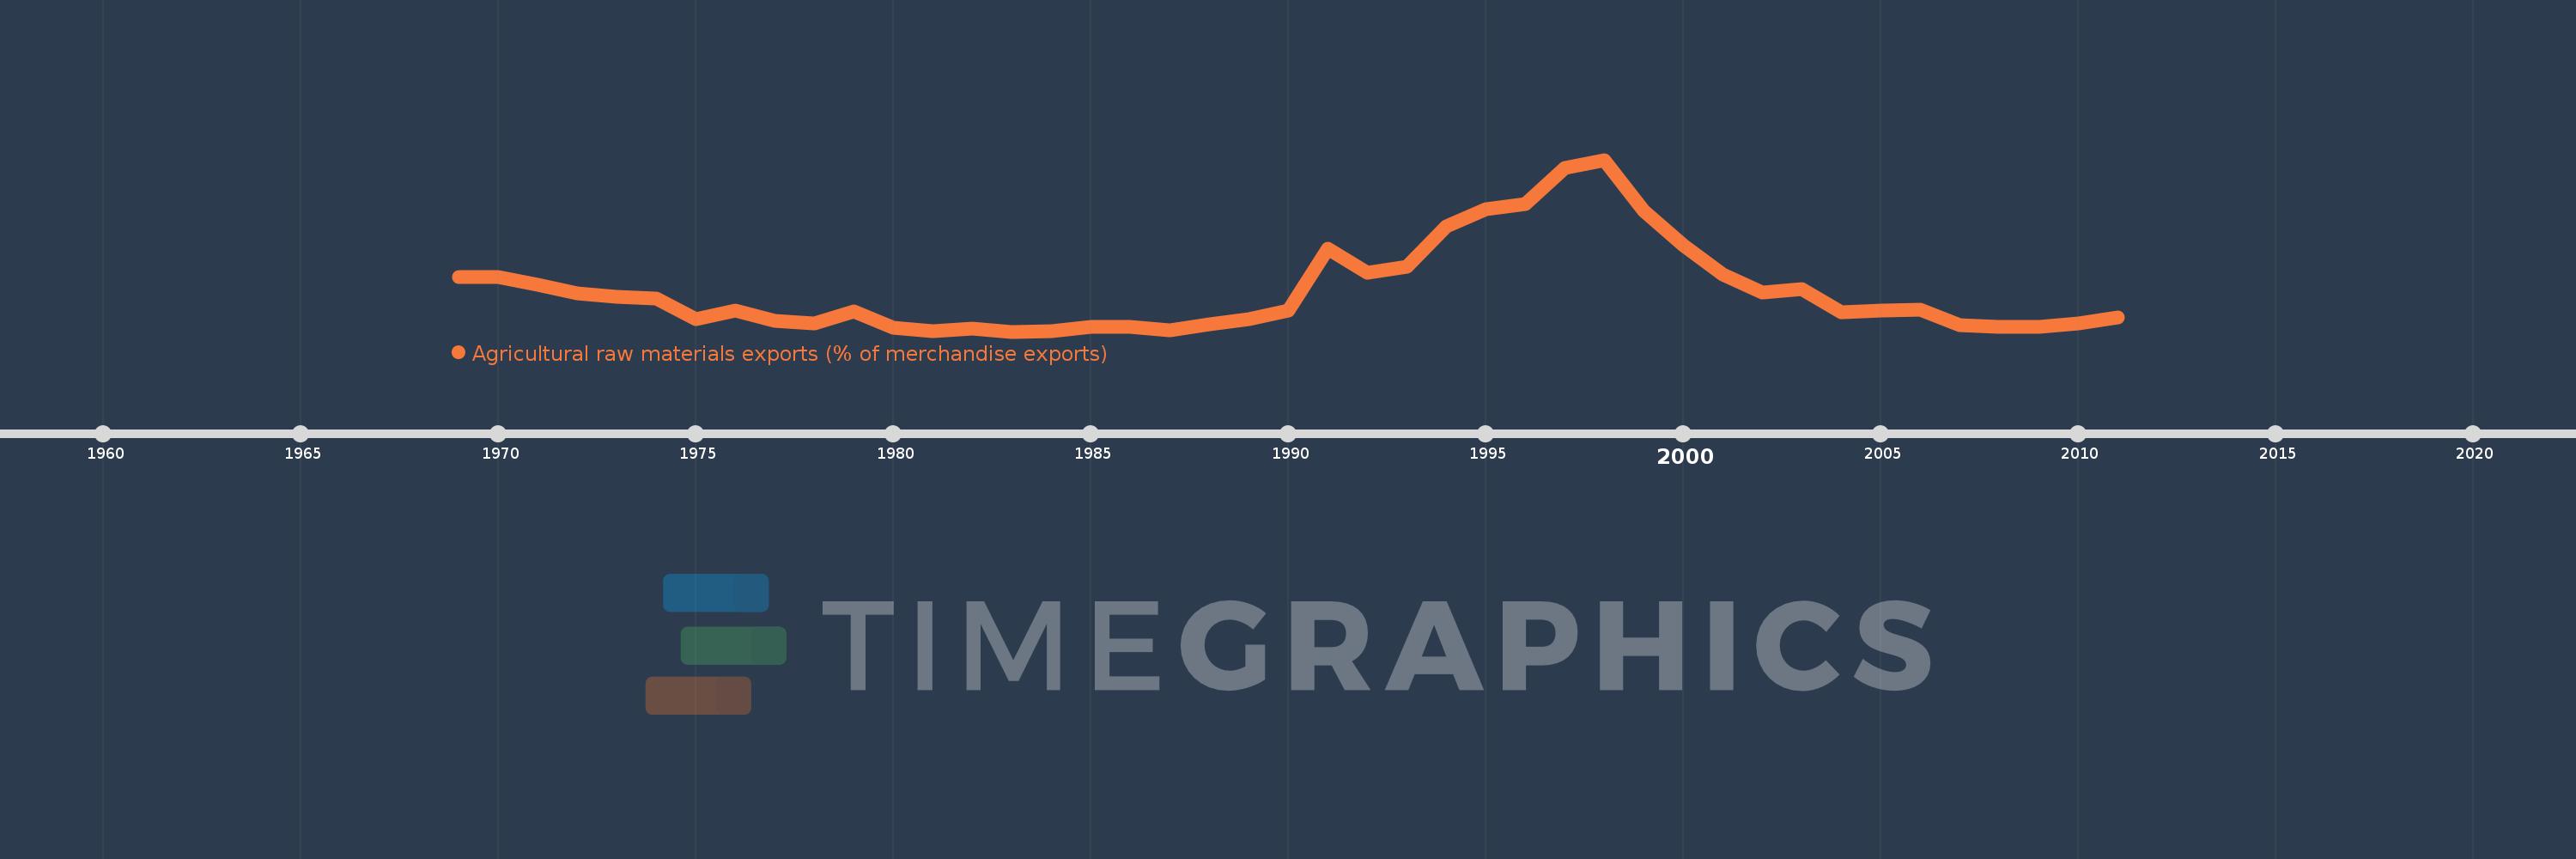
Agricultural raw materials exports (% of merchandise exports)
2011,2010,2009,2008,2007,2006,2005,2004,2003,2002,2001,2000,1999,1998,1997,1996,1995,1994,1993,1992,1991,1990,1989,1988,1987,1986,1985,1984,1983,1982,1981,1980,1979,1978,1977,1976,1975,1974,1973,1972,1971,1970,1969
This statistics in other country:
AfghanistanAlbaniaAlgeriaAndorraAngolaAntigua and BarbudaArab WorldArgentinaArmeniaArubaAustraliaAustriaAzerbaijanBahamas, TheBahrainBangladeshBarbadosBelarusBelgiumBelizeBeninBermudaBhutanBoliviaBosnia and HerzegovinaBotswanaBrazilBrunei DarussalamBulgariaBurkina FasoBurundiCabo VerdeCambodiaCameroonCanadaCaribbean small statesCayman IslandsCentral African RepublicCentral Europe and the BalticsChadChileChinaColombiaComorosCongo, Dem. Rep.Congo, Rep.Costa RicaCote d'IvoireCroatiaCubaCyprusCzech RepublicDenmarkDjiboutiDominicaDominican RepublicEarly-demographic dividendEast Asia & PacificEast Asia & Pacific (excluding high income)East Asia & Pacific (IDA & IBRD countries)EcuadorEgypt, Arab Rep.El SalvadorEquatorial GuineaEritreaEstoniaEthiopiaEuro areaEurope & Central AsiaEurope & Central Asia (excluding high income)Europe & Central Asia (IDA & IBRD countries)European UnionFaroe IslandsFijiFinlandFragile and conflict affected situationsFranceFrench PolynesiaGabonGambia, TheGeorgiaGermanyGhanaGreeceGreenlandGrenadaGuatemalaGuineaGuinea-BissauGuyanaHaitiHeavily indebted poor countries (HIPC)High incomeHondurasHong Kong SAR, ChinaHungaryIBRD onlyIcelandIDA & IBRD totalIDA blendIDA onlyIDA totalIndiaIndonesiaIran, Islamic Rep.IraqIrelandIsraelItalyJamaicaJapanJordanKazakhstanKenyaKiribatiKorea, Rep.KuwaitKyrgyz RepublicLao PDRLate-demographic dividendLatin America & Caribbean Latin America & Caribbean (excluding high income)Latin America & the Caribbean (IDA & IBRD countries)LatviaLeast developed countries: UN classificationLebanonLesothoLiberiaLibyaLithuaniaLow & middle incomeLower middle incomeLuxembourgMacao SAR, ChinaMacedonia, FYRMadagascarMalawiMalaysiaMaldivesMaliMaltaMauritaniaMauritiusMexicoMiddle East & North AfricaMiddle East & North Africa (excluding high income)Middle East & North Africa (IDA & IBRD countries)Middle incomeMoldovaMongoliaMoroccoMozambiqueMyanmarNamibiaNepalNetherlandsNew CaledoniaNew ZealandNicaraguaNigerNigeriaNorth AmericaNorwayOECD membersOmanOther small statesPacific island small statesPakistanPalauPanamaPapua New GuineaParaguayPeruPhilippinesPolandPortugalPost-demographic dividendPre-demographic dividendQatarRomaniaRussian FederationRwandaSamoaSao Tome and PrincipeSaudi ArabiaSenegalSerbiaSeychellesSierra LeoneSingaporeSlovak RepublicSloveniaSmall statesSolomon IslandsSomaliaSouth AfricaSouth AsiaSouth Asia (IDA & IBRD)SpainSri LankaSt. Kitts and NevisSt. LuciaSt. Vincent and the GrenadinesSub-Saharan Africa Sub-Saharan Africa (excluding high income)Sub-Saharan Africa (IDA & IBRD countries)SudanSurinameSwazilandSwedenSwitzerlandSyrian Arab RepublicTajikistanTanzaniaThailandTimor-LesteTogoTongaTrinidad and TobagoTunisiaTurkeyTurkmenistanTurks and Caicos IslandsTuvaluUgandaUkraineUnited Arab EmiratesUnited KingdomUnited StatesUpper middle incomeUruguayVanuatuVenezuela, RBVietnamVirgin Islands (U.S.)WorldYemen, Rep.ZambiaZimbabwe Timeline:
This timeline shows a graph from 1969 to 2011 of Trinidad and Tobago. No data until 1968. Number of actual observations by date: 43.
Source name:
World Development Indicators
Source organization:
World Bank staff estimates from the Comtrade database maintained by the United Nations Statistics Division.
Categories, topics:
Agriculture & Rural Development, Private Sector, Trade
Last updated:
apr 23, 2017
Indicators value changes by year
At the date of observation
Value
Absolute change
Change from previous value
jan 1, 1969
0.075
+0.075
0.0%
jan 1, 1970
0.075
+0.0
0.29%
jan 1, 1971
0.066
-0.01
-13.08%
jan 1, 1972
0.055
-0.011
-16.47%
jan 1, 1973
0.051
-0.004
-7.43%
jan 1, 1974
0.049
-0.001
-2.33%
jan 1, 1975
0.025
-0.025
-50.32%
jan 1, 1976
0.035
+0.01
40.98%
jan 1, 1977
0.023
-0.011
-32.81%
jan 1, 1978
0.02
-0.003
-14.16%
jan 1, 1979
0.034
+0.014
67.85%
jan 1, 1980
0.015
-0.019
-55.87%
jan 1, 1981
0.011
-0.004
-25.05%
jan 1, 1982
0.014
+0.003
24.69%
jan 1, 1983
0.01
-0.004
-29.21%
jan 1, 1984
0.011
+0.001
8.08%
jan 1, 1985
0.016
+0.005
47.02%
jan 1, 1986
0.016
+0.001
3.73%
jan 1, 1987
0.012
-0.004
-23.24%
jan 1, 1988
0.019
+0.007
53.85%
jan 1, 1989
0.025
+0.006
29.03%
jan 1, 1990
0.035
+0.01
41.99%
jan 1, 1991
0.108
+0.073
207.88%
jan 1, 1992
0.08
-0.028
-25.86%
jan 1, 1993
0.087
+0.007
8.73%
jan 1, 1994
0.135
+0.048
55.88%
jan 1, 1995
0.155
+0.02
14.84%
jan 1, 1996
0.161
+0.006
3.93%
jan 1, 1997
0.204
+0.043
26.6%
jan 1, 1998
0.214
+0.01
4.92%
jan 1, 1999
0.153
-0.061
-28.45%
jan 1, 2000
0.113
-0.04
-26.34%
jan 1, 2001
0.078
-0.035
-30.57%
jan 1, 2002
0.056
-0.023
-29.13%
jan 1, 2003
0.06
+0.004
7.92%
jan 1, 2004
0.033
-0.027
-45.77%
jan 1, 2005
0.035
+0.002
7.08%
jan 1, 2006
0.036
+0.001
2.51%
jan 1, 2007
0.018
-0.018
-50.49%
jan 1, 2008
0.016
-0.002
-10.49%
jan 1, 2009
0.016
+0.0
2.56%
jan 1, 2010
0.02
+0.004
22.13%
jan 1, 2011
0.027
+0.007
36.72%
Ranking of countries by current statistics by years


Comments: