29
/
en
AIzaSyAYiBZKx7MnpbEhh9jyipgxe19OcubqV5w
April 1, 2024
125779
El Salvador
SLV
true
2
1
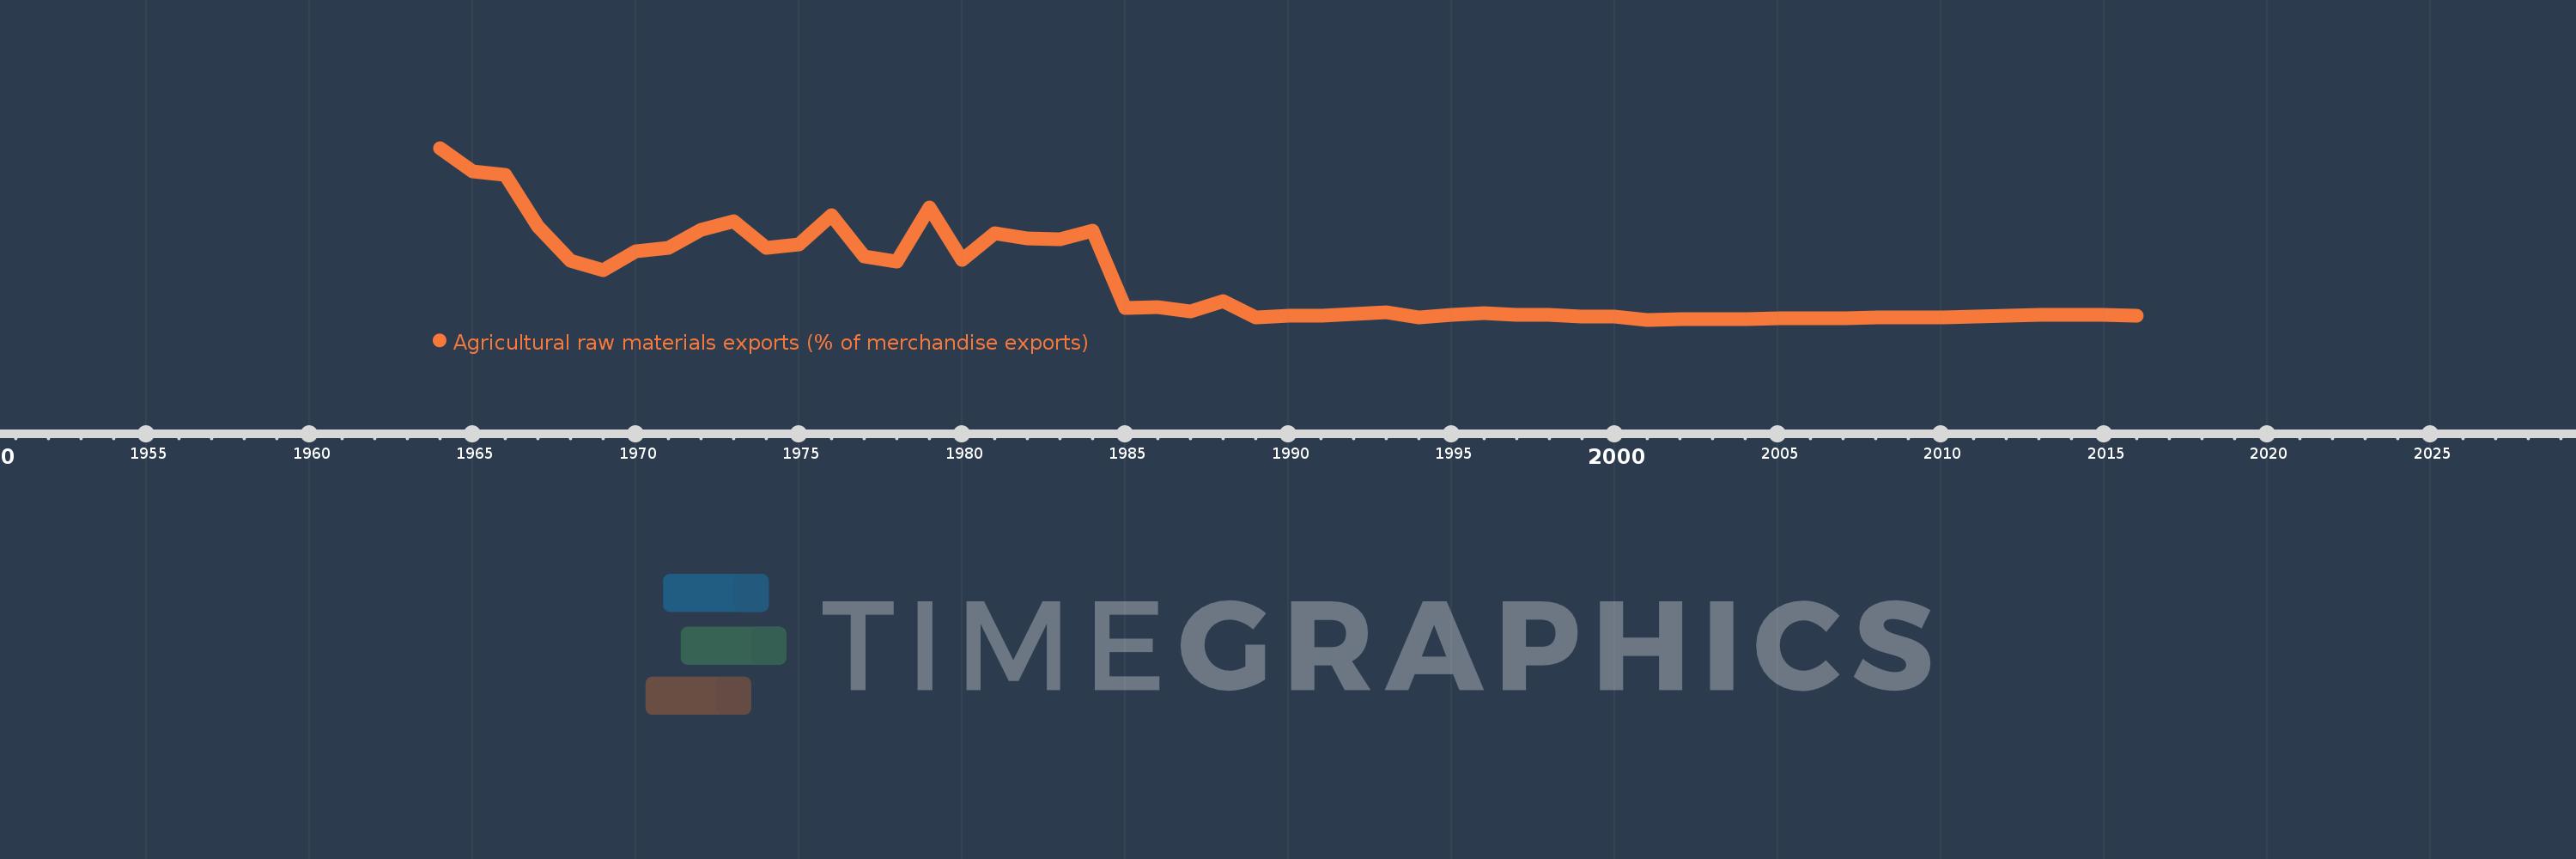
Agricultural raw materials exports (% of merchandise exports)
2016,2015,2014,2013,2012,2011,2010,2009,2008,2007,2006,2005,2004,2003,2002,2001,2000,1999,1998,1997,1996,1995,1994,1993,1992,1991,1990,1989,1988,1987,1986,1985,1984,1983,1982,1981,1980,1979,1978,1977,1976,1975,1974,1973,1972,1971,1970,1969,1968,1967,1966,1965,1964
This statistics in other country:
AfghanistanAlbaniaAlgeriaAndorraAngolaAntigua and BarbudaArab WorldArgentinaArmeniaArubaAustraliaAustriaAzerbaijanBahamas, TheBahrainBangladeshBarbadosBelarusBelgiumBelizeBeninBermudaBhutanBoliviaBosnia and HerzegovinaBotswanaBrazilBrunei DarussalamBulgariaBurkina FasoBurundiCabo VerdeCambodiaCameroonCanadaCaribbean small statesCayman IslandsCentral African RepublicCentral Europe and the BalticsChadChileChinaColombiaComorosCongo, Dem. Rep.Congo, Rep.Costa RicaCote d'IvoireCroatiaCubaCyprusCzech RepublicDenmarkDjiboutiDominicaDominican RepublicEarly-demographic dividendEast Asia & PacificEast Asia & Pacific (excluding high income)East Asia & Pacific (IDA & IBRD countries)EcuadorEgypt, Arab Rep.El SalvadorEquatorial GuineaEritreaEstoniaEthiopiaEuro areaEurope & Central AsiaEurope & Central Asia (excluding high income)Europe & Central Asia (IDA & IBRD countries)European UnionFaroe IslandsFijiFinlandFragile and conflict affected situationsFranceFrench PolynesiaGabonGambia, TheGeorgiaGermanyGhanaGreeceGreenlandGrenadaGuatemalaGuineaGuinea-BissauGuyanaHaitiHeavily indebted poor countries (HIPC)High incomeHondurasHong Kong SAR, ChinaHungaryIBRD onlyIcelandIDA & IBRD totalIDA blendIDA onlyIDA totalIndiaIndonesiaIran, Islamic Rep.IraqIrelandIsraelItalyJamaicaJapanJordanKazakhstanKenyaKiribatiKorea, Rep.KuwaitKyrgyz RepublicLao PDRLate-demographic dividendLatin America & Caribbean Latin America & Caribbean (excluding high income)Latin America & the Caribbean (IDA & IBRD countries)LatviaLeast developed countries: UN classificationLebanonLesothoLiberiaLibyaLithuaniaLow & middle incomeLower middle incomeLuxembourgMacao SAR, ChinaMacedonia, FYRMadagascarMalawiMalaysiaMaldivesMaliMaltaMauritaniaMauritiusMexicoMiddle East & North AfricaMiddle East & North Africa (excluding high income)Middle East & North Africa (IDA & IBRD countries)Middle incomeMoldovaMongoliaMoroccoMozambiqueMyanmarNamibiaNepalNetherlandsNew CaledoniaNew ZealandNicaraguaNigerNigeriaNorth AmericaNorwayOECD membersOmanOther small statesPacific island small statesPakistanPalauPanamaPapua New GuineaParaguayPeruPhilippinesPolandPortugalPost-demographic dividendPre-demographic dividendQatarRomaniaRussian FederationRwandaSamoaSao Tome and PrincipeSaudi ArabiaSenegalSerbiaSeychellesSierra LeoneSingaporeSlovak RepublicSloveniaSmall statesSolomon IslandsSomaliaSouth AfricaSouth AsiaSouth Asia (IDA & IBRD)SpainSri LankaSt. Kitts and NevisSt. LuciaSt. Vincent and the GrenadinesSub-Saharan Africa Sub-Saharan Africa (excluding high income)Sub-Saharan Africa (IDA & IBRD countries)SudanSurinameSwazilandSwedenSwitzerlandSyrian Arab RepublicTajikistanTanzaniaThailandTimor-LesteTogoTongaTrinidad and TobagoTunisiaTurkeyTurkmenistanTurks and Caicos IslandsTuvaluUgandaUkraineUnited Arab EmiratesUnited KingdomUnited StatesUpper middle incomeUruguayVanuatuVenezuela, RBVietnamVirgin Islands (U.S.)WorldYemen, Rep.ZambiaZimbabwe Timeline:
This timeline shows a graph from 1964 to 2016 of El Salvador. No data until 1963. Number of actual observations by date: 53.
Source name:
World Development Indicators
Source organization:
World Bank staff estimates from the Comtrade database maintained by the United Nations Statistics Division.
Categories, topics:
Agriculture & Rural Development, Private Sector, Trade
Last updated:
apr 23, 2017
Indicators value changes by year
Maximum:
24.642
jan 1, 1964
At the date of observation
Value
Absolute change
Change from previous value
jan 1, 1964
24.642
+24.642
0.0%
jan 1, 1965
21.283
-3.359
-13.63%
jan 1, 1966
20.809
-0.474
-2.23%
jan 1, 1967
13.424
-7.385
-35.49%
jan 1, 1968
8.608
-4.816
-35.87%
jan 1, 1969
7.227
-1.382
-16.05%
jan 1, 1970
9.928
+2.702
37.39%
jan 1, 1971
10.452
+0.523
5.27%
jan 1, 1972
13.028
+2.577
24.65%
jan 1, 1973
14.245
+1.216
9.34%
jan 1, 1974
10.429
-3.816
-26.79%
jan 1, 1975
10.941
+0.512
4.91%
jan 1, 1976
15.127
+4.186
38.26%
jan 1, 1977
9.207
-5.92
-39.13%
jan 1, 1978
8.517
-0.69
-7.49%
jan 1, 1979
16.224
+7.706
90.48%
jan 1, 1980
8.68
-7.544
-46.5%
jan 1, 1981
12.47
+3.791
43.67%
jan 1, 1982
11.755
-0.715
-5.73%
jan 1, 1983
11.645
-0.111
-0.94%
jan 1, 1984
12.85
+1.205
10.35%
jan 1, 1985
1.868
-10.982
-85.46%
jan 1, 1986
1.942
+0.074
3.97%
jan 1, 1987
1.414
-0.528
-27.19%
jan 1, 1988
2.857
+1.443
102.09%
jan 1, 1989
0.581
-2.276
-79.67%
jan 1, 1990
0.739
+0.158
27.23%
jan 1, 1991
0.804
+0.065
8.73%
jan 1, 1992
1.028
+0.225
27.99%
jan 1, 1993
1.318
+0.289
28.15%
jan 1, 1994
0.566
-0.752
-57.09%
jan 1, 1995
0.874
+0.308
54.52%
jan 1, 1996
1.153
+0.279
31.91%
jan 1, 1997
0.918
-0.235
-20.39%
jan 1, 1998
0.843
-0.074
-8.09%
jan 1, 1999
0.663
-0.18
-21.39%
jan 1, 2000
0.633
-0.03
-4.53%
jan 1, 2001
0.2
-0.433
-68.46%
jan 1, 2002
0.261
+0.061
30.59%
jan 1, 2003
0.312
+0.051
19.72%
jan 1, 2004
0.287
-0.025
-8.12%
jan 1, 2005
0.359
+0.072
25.05%
jan 1, 2006
0.4
+0.041
11.42%
jan 1, 2007
0.376
-0.023
-5.82%
jan 1, 2008
0.576
+0.199
53.0%
jan 1, 2009
0.573
-0.002
-0.39%
jan 1, 2010
0.57
-0.004
-0.65%
jan 1, 2011
0.656
+0.086
15.13%
jan 1, 2012
0.827
+0.172
26.15%
jan 1, 2013
0.902
+0.074
8.96%
jan 1, 2014
0.926
+0.025
2.75%
jan 1, 2015
0.89
-0.037
-3.97%
jan 1, 2016
0.823
-0.067
-7.51%
Ranking of countries by current statistics by years


Comments: