29
/
en
AIzaSyAYiBZKx7MnpbEhh9jyipgxe19OcubqV5w
April 1, 2024
234385
Saudi Arabia
SAU
true
2
1
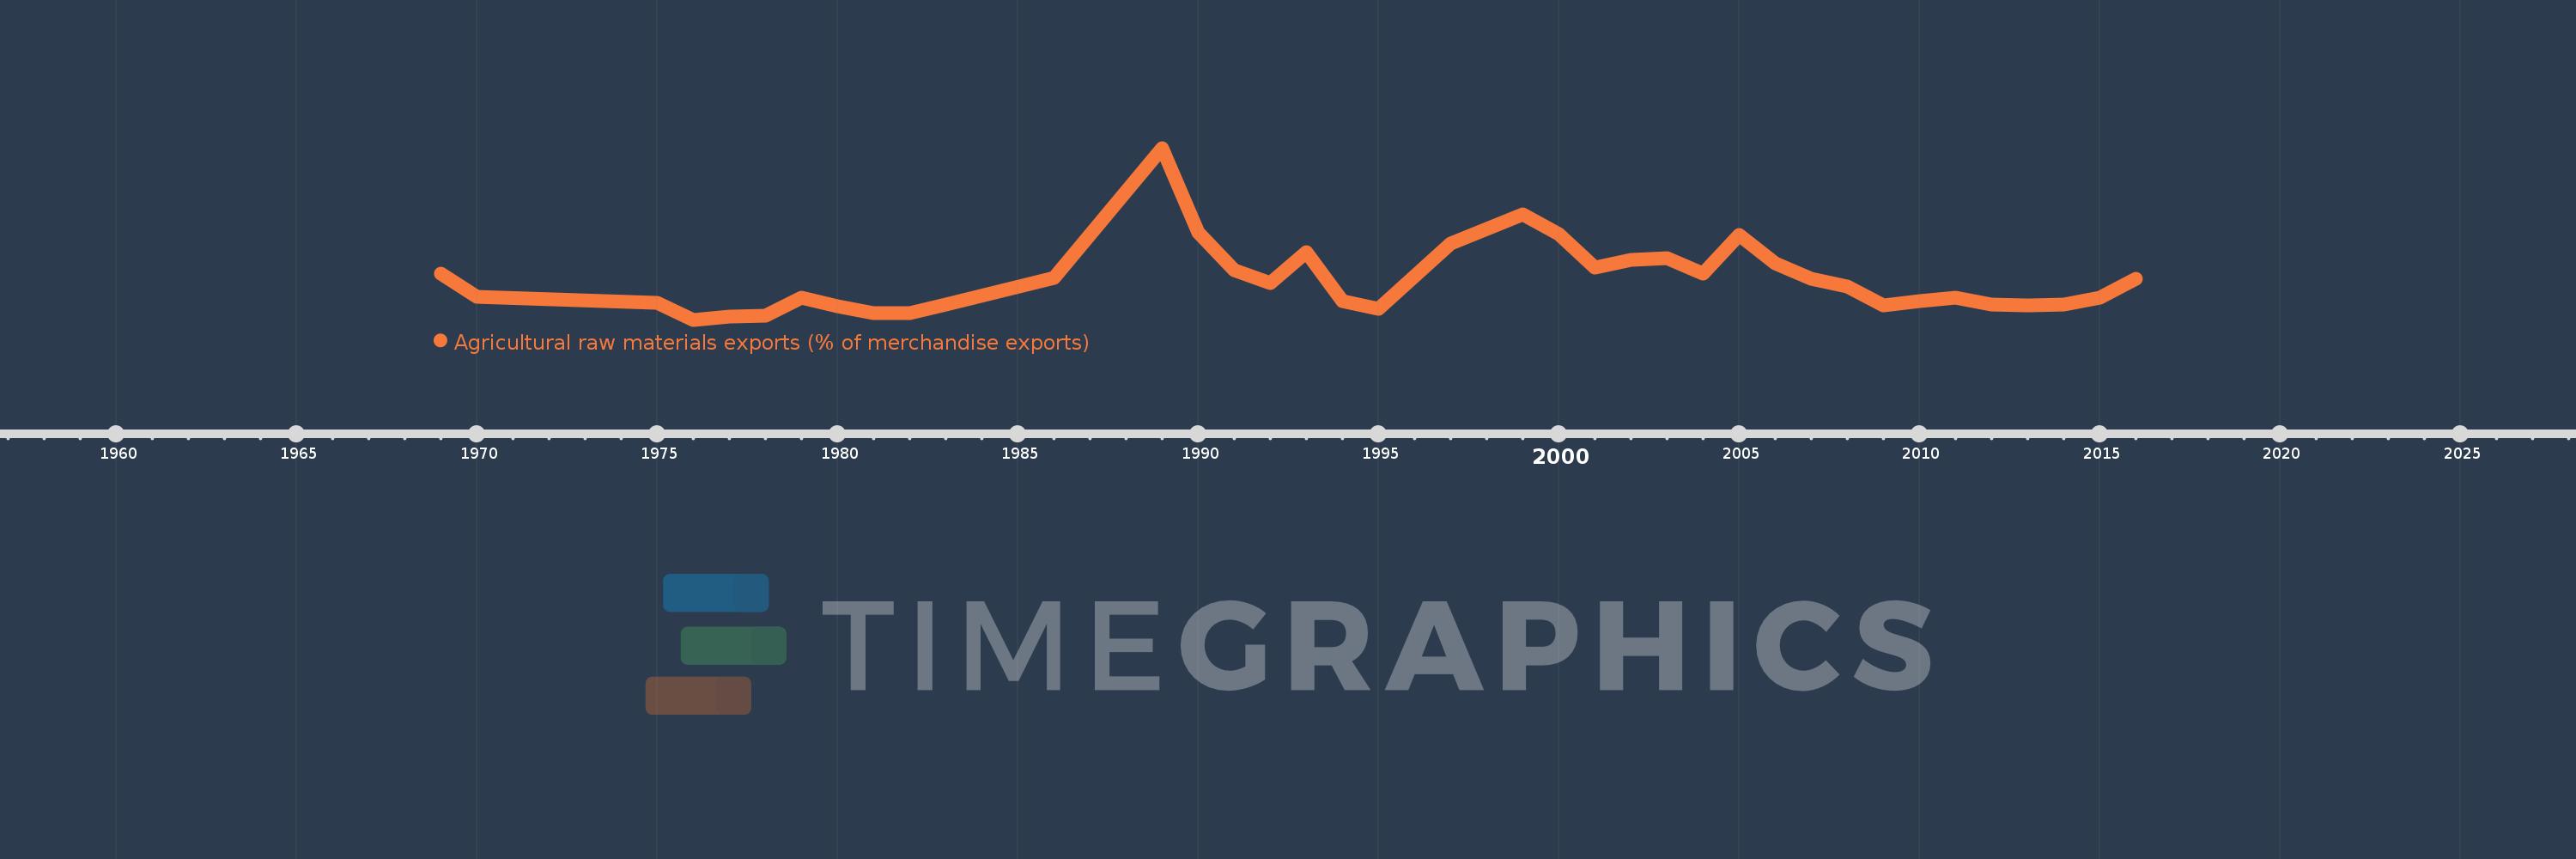
Agricultural raw materials exports (% of merchandise exports)
2016,2015,2014,2013,2012,2011,2010,2009,2008,2007,2006,2005,2004,2003,2002,2001,2000,1999,1997,1995,1994,1993,1992,1991,1990,1989,1986,1983,1982,1981,1980,1979,1978,1977,1976,1975,1970,1969
This statistics in other country:
AfghanistanAlbaniaAlgeriaAndorraAngolaAntigua and BarbudaArab WorldArgentinaArmeniaArubaAustraliaAustriaAzerbaijanBahamas, TheBahrainBangladeshBarbadosBelarusBelgiumBelizeBeninBermudaBhutanBoliviaBosnia and HerzegovinaBotswanaBrazilBrunei DarussalamBulgariaBurkina FasoBurundiCabo VerdeCambodiaCameroonCanadaCaribbean small statesCayman IslandsCentral African RepublicCentral Europe and the BalticsChadChileChinaColombiaComorosCongo, Dem. Rep.Congo, Rep.Costa RicaCote d'IvoireCroatiaCubaCyprusCzech RepublicDenmarkDjiboutiDominicaDominican RepublicEarly-demographic dividendEast Asia & PacificEast Asia & Pacific (excluding high income)East Asia & Pacific (IDA & IBRD countries)EcuadorEgypt, Arab Rep.El SalvadorEquatorial GuineaEritreaEstoniaEthiopiaEuro areaEurope & Central AsiaEurope & Central Asia (excluding high income)Europe & Central Asia (IDA & IBRD countries)European UnionFaroe IslandsFijiFinlandFragile and conflict affected situationsFranceFrench PolynesiaGabonGambia, TheGeorgiaGermanyGhanaGreeceGreenlandGrenadaGuatemalaGuineaGuinea-BissauGuyanaHaitiHeavily indebted poor countries (HIPC)High incomeHondurasHong Kong SAR, ChinaHungaryIBRD onlyIcelandIDA & IBRD totalIDA blendIDA onlyIDA totalIndiaIndonesiaIran, Islamic Rep.IraqIrelandIsraelItalyJamaicaJapanJordanKazakhstanKenyaKiribatiKorea, Rep.KuwaitKyrgyz RepublicLao PDRLate-demographic dividendLatin America & Caribbean Latin America & Caribbean (excluding high income)Latin America & the Caribbean (IDA & IBRD countries)LatviaLeast developed countries: UN classificationLebanonLesothoLiberiaLibyaLithuaniaLow & middle incomeLower middle incomeLuxembourgMacao SAR, ChinaMacedonia, FYRMadagascarMalawiMalaysiaMaldivesMaliMaltaMauritaniaMauritiusMexicoMiddle East & North AfricaMiddle East & North Africa (excluding high income)Middle East & North Africa (IDA & IBRD countries)Middle incomeMoldovaMongoliaMoroccoMozambiqueMyanmarNamibiaNepalNetherlandsNew CaledoniaNew ZealandNicaraguaNigerNigeriaNorth AmericaNorwayOECD membersOmanOther small statesPacific island small statesPakistanPalauPanamaPapua New GuineaParaguayPeruPhilippinesPolandPortugalPost-demographic dividendPre-demographic dividendQatarRomaniaRussian FederationRwandaSamoaSao Tome and PrincipeSaudi ArabiaSenegalSerbiaSeychellesSierra LeoneSingaporeSlovak RepublicSloveniaSmall statesSolomon IslandsSomaliaSouth AfricaSouth AsiaSouth Asia (IDA & IBRD)SpainSri LankaSt. Kitts and NevisSt. LuciaSt. Vincent and the GrenadinesSub-Saharan Africa Sub-Saharan Africa (excluding high income)Sub-Saharan Africa (IDA & IBRD countries)SudanSurinameSwazilandSwedenSwitzerlandSyrian Arab RepublicTajikistanTanzaniaThailandTimor-LesteTogoTongaTrinidad and TobagoTunisiaTurkeyTurkmenistanTurks and Caicos IslandsTuvaluUgandaUkraineUnited Arab EmiratesUnited KingdomUnited StatesUpper middle incomeUruguayVanuatuVenezuela, RBVietnamVirgin Islands (U.S.)WorldYemen, Rep.ZambiaZimbabwe Timeline:
This timeline shows a graph from 1969 to 2016 of Saudi Arabia. No data until 1968. Number of actual observations by date: 38.
Source name:
World Development Indicators
Source organization:
World Bank staff estimates from the Comtrade database maintained by the United Nations Statistics Division.
Categories, topics:
Agriculture & Rural Development, Private Sector, Trade
Last updated:
apr 23, 2017
Indicators value changes by year
At the date of observation
Value
Absolute change
Change from previous value
jan 1, 1969
0.046
+0.046
0.0%
jan 1, 1970
0.025
-0.021
-45.25%
jan 1, 1975
0.019
-0.007
-26.14%
jan 1, 1976
0.004
-0.015
-78.7%
jan 1, 1977
0.007
+0.003
70.87%
jan 1, 1978
0.008
+0.002
23.23%
jan 1, 1979
0.024
+0.015
183.02%
jan 1, 1980
0.016
-0.008
-31.91%
jan 1, 1981
0.01
-0.006
-37.47%
jan 1, 1982
0.01
-0.001
-5.48%
jan 1, 1983
0.018
+0.009
92.05%
jan 1, 1986
0.042
+0.023
127.15%
jan 1, 1989
0.16
+0.118
282.54%
jan 1, 1990
0.083
-0.077
-48.18%
jan 1, 1991
0.049
-0.034
-40.5%
jan 1, 1992
0.037
-0.012
-24.5%
jan 1, 1993
0.065
+0.028
74.28%
jan 1, 1994
0.021
-0.044
-67.08%
jan 1, 1995
0.014
-0.007
-33.79%
jan 1, 1997
0.073
+0.059
416.52%
jan 1, 1999
0.1
+0.027
37.01%
jan 1, 2000
0.082
-0.018
-18.44%
jan 1, 2001
0.051
-0.031
-38.17%
jan 1, 2002
0.058
+0.007
14.26%
jan 1, 2003
0.06
+0.002
4.03%
jan 1, 2004
0.046
-0.014
-23.85%
jan 1, 2005
0.081
+0.036
77.98%
jan 1, 2006
0.055
-0.026
-32.26%
jan 1, 2007
0.041
-0.015
-26.39%
jan 1, 2008
0.034
-0.006
-15.51%
jan 1, 2009
0.017
-0.018
-51.18%
jan 1, 2010
0.021
+0.004
24.55%
jan 1, 2011
0.024
+0.003
15.62%
jan 1, 2012
0.018
-0.006
-26.89%
jan 1, 2013
0.017
-0.001
-5.55%
jan 1, 2014
0.018
+0.001
5.37%
jan 1, 2015
0.024
+0.007
37.67%
jan 1, 2016
0.041
+0.017
70.97%
Ranking of countries by current statistics by years


Comments: