29
/
en
AIzaSyAYiBZKx7MnpbEhh9jyipgxe19OcubqV5w
April 1, 2024
220436
Paraguay
PRY
true
2
1
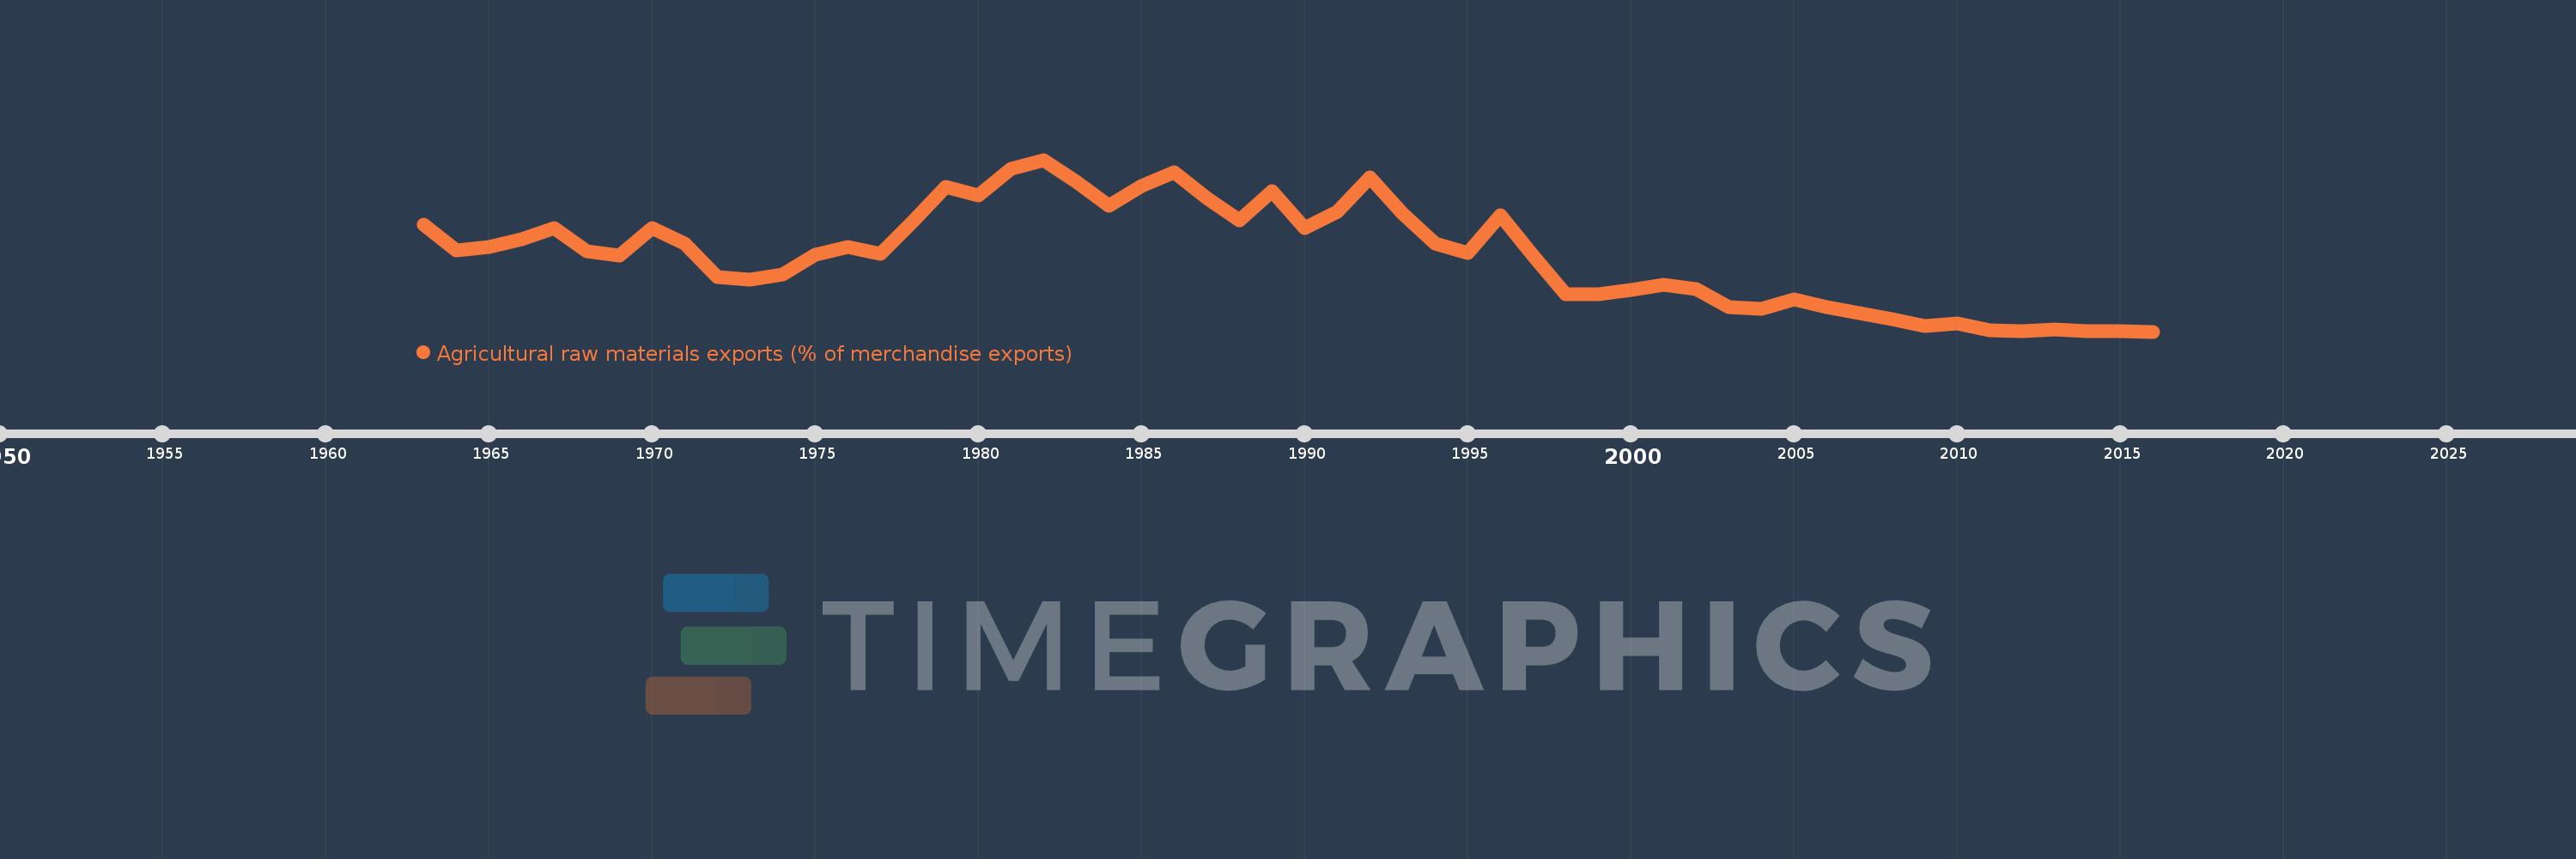
Agricultural raw materials exports (% of merchandise exports)
2016,2015,2014,2013,2012,2011,2010,2009,2008,2007,2006,2005,2004,2003,2002,2001,2000,1999,1998,1997,1996,1995,1994,1993,1992,1991,1990,1989,1988,1987,1986,1985,1984,1983,1982,1981,1980,1979,1978,1977,1976,1975,1974,1973,1972,1971,1970,1969,1968,1967,1966,1965,1964,1963
This statistics in other country:
AfghanistanAlbaniaAlgeriaAndorraAngolaAntigua and BarbudaArab WorldArgentinaArmeniaArubaAustraliaAustriaAzerbaijanBahamas, TheBahrainBangladeshBarbadosBelarusBelgiumBelizeBeninBermudaBhutanBoliviaBosnia and HerzegovinaBotswanaBrazilBrunei DarussalamBulgariaBurkina FasoBurundiCabo VerdeCambodiaCameroonCanadaCaribbean small statesCayman IslandsCentral African RepublicCentral Europe and the BalticsChadChileChinaColombiaComorosCongo, Dem. Rep.Congo, Rep.Costa RicaCote d'IvoireCroatiaCubaCyprusCzech RepublicDenmarkDjiboutiDominicaDominican RepublicEarly-demographic dividendEast Asia & PacificEast Asia & Pacific (excluding high income)East Asia & Pacific (IDA & IBRD countries)EcuadorEgypt, Arab Rep.El SalvadorEquatorial GuineaEritreaEstoniaEthiopiaEuro areaEurope & Central AsiaEurope & Central Asia (excluding high income)Europe & Central Asia (IDA & IBRD countries)European UnionFaroe IslandsFijiFinlandFragile and conflict affected situationsFranceFrench PolynesiaGabonGambia, TheGeorgiaGermanyGhanaGreeceGreenlandGrenadaGuatemalaGuineaGuinea-BissauGuyanaHaitiHeavily indebted poor countries (HIPC)High incomeHondurasHong Kong SAR, ChinaHungaryIBRD onlyIcelandIDA & IBRD totalIDA blendIDA onlyIDA totalIndiaIndonesiaIran, Islamic Rep.IraqIrelandIsraelItalyJamaicaJapanJordanKazakhstanKenyaKiribatiKorea, Rep.KuwaitKyrgyz RepublicLao PDRLate-demographic dividendLatin America & Caribbean Latin America & Caribbean (excluding high income)Latin America & the Caribbean (IDA & IBRD countries)LatviaLeast developed countries: UN classificationLebanonLesothoLiberiaLibyaLithuaniaLow & middle incomeLower middle incomeLuxembourgMacao SAR, ChinaMacedonia, FYRMadagascarMalawiMalaysiaMaldivesMaliMaltaMauritaniaMauritiusMexicoMiddle East & North AfricaMiddle East & North Africa (excluding high income)Middle East & North Africa (IDA & IBRD countries)Middle incomeMoldovaMongoliaMoroccoMozambiqueMyanmarNamibiaNepalNetherlandsNew CaledoniaNew ZealandNicaraguaNigerNigeriaNorth AmericaNorwayOECD membersOmanOther small statesPacific island small statesPakistanPalauPanamaPapua New GuineaParaguayPeruPhilippinesPolandPortugalPost-demographic dividendPre-demographic dividendQatarRomaniaRussian FederationRwandaSamoaSao Tome and PrincipeSaudi ArabiaSenegalSerbiaSeychellesSierra LeoneSingaporeSlovak RepublicSloveniaSmall statesSolomon IslandsSomaliaSouth AfricaSouth AsiaSouth Asia (IDA & IBRD)SpainSri LankaSt. Kitts and NevisSt. LuciaSt. Vincent and the GrenadinesSub-Saharan Africa Sub-Saharan Africa (excluding high income)Sub-Saharan Africa (IDA & IBRD countries)SudanSurinameSwazilandSwedenSwitzerlandSyrian Arab RepublicTajikistanTanzaniaThailandTimor-LesteTogoTongaTrinidad and TobagoTunisiaTurkeyTurkmenistanTurks and Caicos IslandsTuvaluUgandaUkraineUnited Arab EmiratesUnited KingdomUnited StatesUpper middle incomeUruguayVanuatuVenezuela, RBVietnamVirgin Islands (U.S.)WorldYemen, Rep.ZambiaZimbabwe Timeline:
This timeline shows a graph from 1963 to 2016 of Paraguay. No data until 1962. Number of actual observations by date: 54.
Source name:
World Development Indicators
Source organization:
World Bank staff estimates from the Comtrade database maintained by the United Nations Statistics Division.
Categories, topics:
Agriculture & Rural Development, Private Sector, Trade
Last updated:
apr 23, 2017
Indicators value changes by year
Maximum:
53.121
jan 1, 1982
At the date of observation
Value
Absolute change
Change from previous value
jan 1, 1963
33.615
+33.615
0.0%
jan 1, 1964
25.959
-7.656
-22.78%
jan 1, 1965
26.863
+0.904
3.48%
jan 1, 1966
29.233
+2.37
8.82%
jan 1, 1967
32.71
+3.477
11.89%
jan 1, 1968
25.667
-7.043
-21.53%
jan 1, 1969
24.332
-1.335
-5.2%
jan 1, 1970
32.743
+8.411
34.57%
jan 1, 1971
28.062
-4.681
-14.3%
jan 1, 1972
18.004
-10.058
-35.84%
jan 1, 1973
17.167
-0.837
-4.65%
jan 1, 1974
18.697
+1.53
8.91%
jan 1, 1975
24.659
+5.961
31.88%
jan 1, 1976
27.064
+2.405
9.75%
jan 1, 1977
24.834
-2.229
-8.24%
jan 1, 1978
34.739
+9.905
39.88%
jan 1, 1979
45.015
+10.275
29.58%
jan 1, 1980
42.47
-2.544
-5.65%
jan 1, 1981
50.405
+7.934
18.68%
jan 1, 1982
53.121
+2.716
5.39%
jan 1, 1983
46.561
-6.56
-12.35%
jan 1, 1984
39.322
-7.239
-15.55%
jan 1, 1985
45.206
+5.884
14.96%
jan 1, 1986
49.495
+4.289
9.49%
jan 1, 1987
41.647
-7.847
-15.86%
jan 1, 1988
35.06
-6.587
-15.82%
jan 1, 1989
43.689
+8.628
24.61%
jan 1, 1990
32.693
-10.995
-25.17%
jan 1, 1991
37.637
+4.944
15.12%
jan 1, 1992
47.714
+10.077
26.77%
jan 1, 1993
37.108
-10.605
-22.23%
jan 1, 1994
27.975
-9.133
-24.61%
jan 1, 1995
25.152
-2.822
-10.09%
jan 1, 1996
36.372
+11.219
44.61%
jan 1, 1997
24.5
-11.872
-32.64%
jan 1, 1998
12.804
-11.696
-47.74%
jan 1, 1999
12.793
-0.011
-0.08%
jan 1, 2000
14.126
+1.333
10.42%
jan 1, 2001
15.493
+1.367
9.68%
jan 1, 2002
14.436
-1.057
-6.82%
jan 1, 2003
9.006
-5.429
-37.61%
jan 1, 2004
8.36
-0.647
-7.18%
jan 1, 2005
11.174
+2.814
33.66%
jan 1, 2006
8.962
-2.211
-19.79%
jan 1, 2007
7.068
-1.894
-21.14%
jan 1, 2008
5.209
-1.859
-26.31%
jan 1, 2009
3.264
-1.945
-37.34%
jan 1, 2010
3.901
+0.638
19.54%
jan 1, 2011
2.066
-1.835
-47.03%
jan 1, 2012
1.666
-0.4
-19.37%
jan 1, 2013
2.154
+0.488
29.29%
jan 1, 2014
1.691
-0.463
-21.48%
jan 1, 2015
1.59
-0.101
-5.98%
jan 1, 2016
1.57
-0.02
-1.28%
Ranking of countries by current statistics by years


Comments: